Volume-Weighted Average Price (VWAP): Definition
Mar 07, 2024

Trading in the financial market entails taking calculated risks and relying on analytics in making investment decisions. Investors who only follow the trends and execute orders based on others’ activities are more exposed to risks if the market moves unexpectedly.
Experienced investors use a set of technical indicators and tools to analyse stock prices or monitor the Forex market activity before making decisions. The volume-weighted average price is a useful analysis tool that illustrates the asset value changes throughout the day.
The VWAPhas special uses and can be combined with different indicators to get the best results. Let’s explain how to calculate VWAPand the best way to trade with it.
Key Takeaways
- The volume-weighted average price is a trend-identifying indicator that assists traders in finding the right time to enter or exit the market.
- The VWAP shows the average asset price throughout the day, which resets with every new trading day.
- The VWAP is calculated using the average asset price and factoring the cumulative volume to get more accurate results.
- Other indicators, such as trend lines and Bollinger bands, can be used with the VWAP for better accuracy.
Understanding The Volume-Weighted Average Price
The volume-weighted average price is an indicator that shows the daily trading volume of the subject asset. It tracks the price of the financial security during the day and shows the price fluctuations from the moment the daily trading starts until the end of the session.
The VWAP resets every day to give an accurate reading of the daily volume-weighted price. It is a common strategy for intraday or short-term traders who engage in buying and selling financial instruments during the market’s daily working hours.
The VWAP indicator helps traders understand the daily asset price fluctuations and determine the right time to enter or exit the market.
Many stock traders use the VWAP technical indicator to analyse intraday charts and determine their approach, whether they want to engage actively or passively in stock trading.
It can also be used in the currency market, where Forex traders can track the best-performing pairs and capitalise on gaining opportunities as currency prices fluctuate.
How is The Volume-Weighted Average Indicator Used?
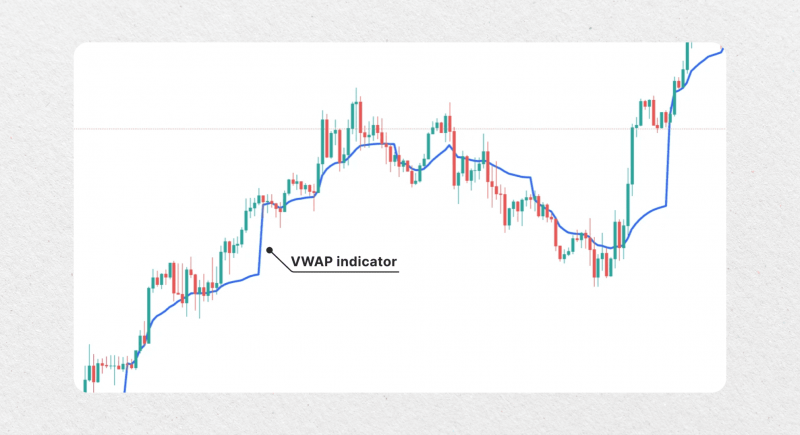
The volume-weighted average price indicator can be used as a tool to confirm a market trend direction, determining whether the market is bullish or bearish. Trend traders incorporate VWAP in their trading strategy to identify when to open or close positions.
Additionally, VWAP helps traders execute the right order type. For example, if the market price under VWAP moves over it, traders can process a long order because prices are increasing.
Conversely, if prices over VWAP start moving under the indicator, investors can execute short orders as the price moves downwards.
Investment firms, such as hedge funds and mutual funds, use VWAP to process market orders without significantly affecting the market dynamics.
For example, institutional buyers may buy when the price is below VWAP or sell when the price is still above VWAP to keep the price around the average. This way, executing large orders has a smoother effect on the market without causing major shifts.
How to Calculate Volume-Weighted Average Price
The average price-weighted indicator is constructed using the asset trading price and volume, creating a benchmark that helps traders assess the market price and make trading decisions.
This average price reflects the intraday value of the subject asset, calculated by summing the dollar value of all transactions and dividing it by the total number of traded shares to get the following volume-weighted average price formula:

Meanwhile, the cumulative average price refers to the sum of average prices since the beginning of the trading session that day.
Luckily, traders do not have to manually implement the VWAP formula while pursuing their investment strategy because most modern trading software and platforms make the calculations automatically. However, you can calculate the volume-weighted average price in Excel with the following steps.
- Calculate the typical price of a particular timeline, let’s say, over five minutes. To do so, take the sum of the high, low, and close prices and divide it by three, or (H+L+C/3).
- Multiply the resulting number by the volume traded within the mentioned period and call it PV (price value).
- Calculate the price value of different timelines by taking the high, low and close figures of other periods and multiplying them by the relevant volume.
- Divide the PV by the cumulative traded volumes to get the VWAP.
Moving Averages vs VWAP
The volume-weighted average price is frequently compared to the moving average indicator, as both have similar characteristics and utility. However, these two indicators bring different results.
The VWAP and the simple moving averages are lagging indicators. Despite the fact that the VWAP shows the daily average asset price, it can be used to track prices of different timelines, whether it’s five minutes or five hours. Therefore, it uses historical data, which makes it a lagging indicator.
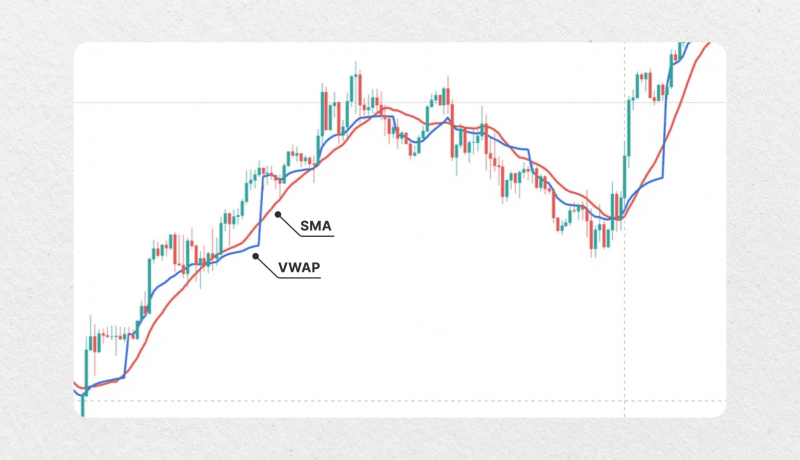
The vwap calculation takes into account the asset’s trading volume and the cumulative volume, which makes it more accurate than a simple moving average.
The MA indicator is calculated using closing prices over a certain period and dividing the total by the number of periods, while the VWAP factors volume to obtain more accurate results that help traders make accurate decisions.
How to Read The VWAP on The Trading Chart
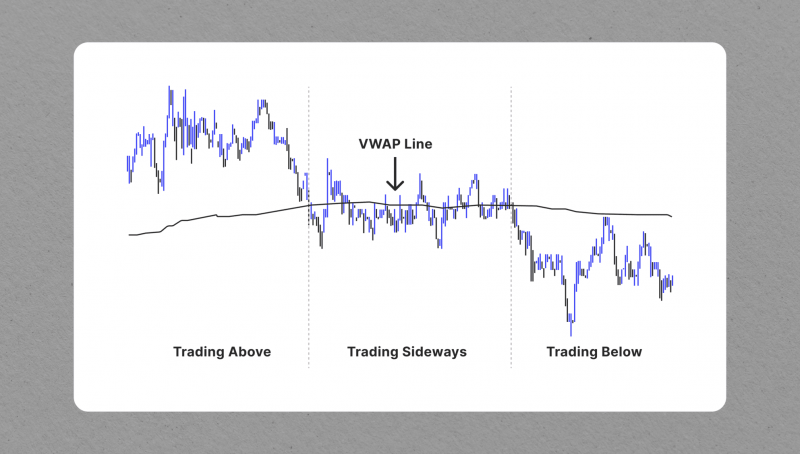
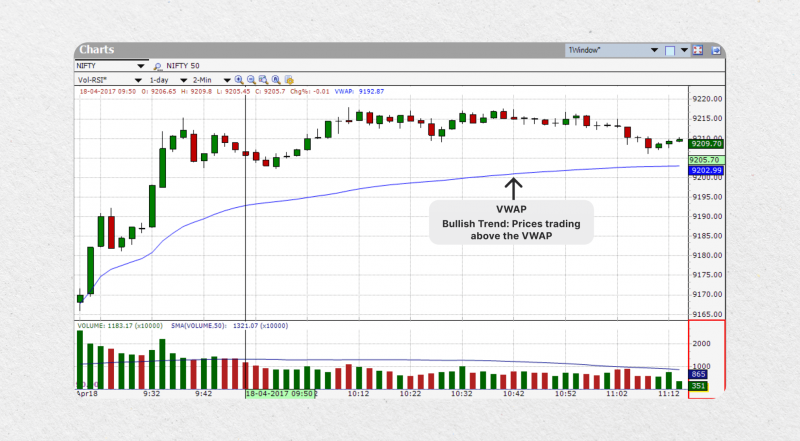
The volume-weighted average is depicted on the chart with a single line that moves along the asset price, crossing it up and down as the daily average price fluctuates.
Tracking the VWAP line on the chart, traders can compare its movement with the market price, dictating the proper order execution.
If the VWAP line is above the market price, it means that the asset is being traded at a higher price, and a retraction is possible. On the other hand, if the VWAP line is below the market value, it means the asset is traded at a lower price and is bound to rebound higher.
The VWAP line on the chart can show if the market is moving bullish or bearish. If the price line crosses the VWAP up, it indicates a bull market as prices increase over the average.
However, if the market price line drops below the VWAP, it indicates a bear market, where traders can execute a short position.
VWAP Trading Strategies
The VWAP indicator helps find the right moment to enter or exit the market by comparing the asset price line to the VWAP as a benchmark.
VWAP Bands
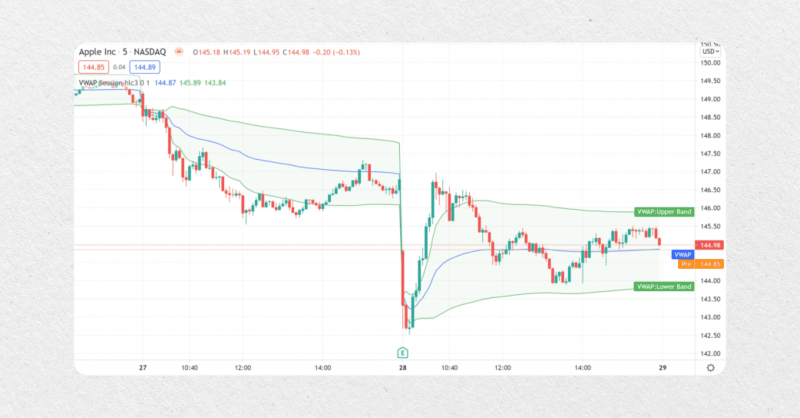
This strategy implies drawing upper and lower lines around the VWAP line and executing market orders depending on how the market price moves between these two bands.
If the asset price moves towards the upper band, it indicates the start of an upward trend, where investors can enter a long position.
Conversely, if the price drops alongside the lower band, it indicates a downward trend, where investors can enter a short position.
Pullbacks
The pullback strategy relies on seizing short-term retractions that happen during a strong trend momentum.
For example, if the market is experiencing a significant upward trend, the price line will eventually slow down and drop down the VWAP average price. This way, traders can place a sell order as prices decrease.
Then, after the market price reaches the average, it is more likely to increase slightly, where traders can put a buy order and capitalise on price increments.
Fast Fact
The pullback trading strategy can be risky if a trader enters the market too early before the pullback or if prices take too long before retraction.
Pair Trading
This strategy implies placing two market orders in opposite directions. Thus, a trader executes a buy order when the market price is below the VWAP and a sell order when the price is above the VWAP average.
The strategy here is to rely on the market dynamics during a trend movement, and both market prices retract back to the average VWAP price, allowing traders to benefit from both positions.
Technical Indicators to Combine with VWAP
Despite the high accuracy of volume-weighted average price, calculating VWAP in combination with other technical indicators is a common practice for skilled traders.
Trend Lines
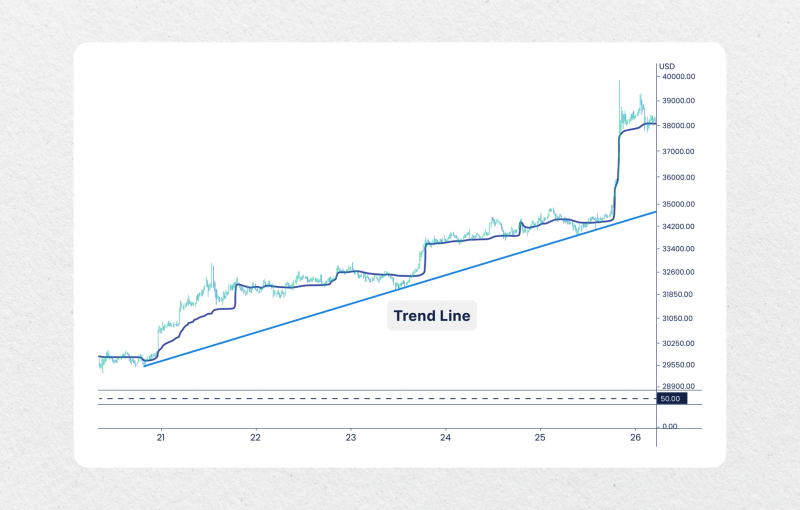
Drawing a trend line across the chart helps traders make a two-point comparison to increase the accuracy of their estimations. Thus, during a positive trend, investors draw an upward line and analyse the touchpoints with the market price and the VWAP line.
If the market price crosses the trendline and is above the VWAP line, it indicates a bullish market. On the other hand, if the market price touches the trendline and is below the VWAP average indicator, it refers to a bearish market.
Bollinger Bands
Bollinger bands are used with the VWAP indicator to identify more accurate entry and exit points. This way, traders utilise a three-point comparison to confirm a specific trend.
The Bollinger bands consist of three lines: upper line (bull market), lower line (bear market) and middle line (average market price).
If the stock price trades above the middle line and towards the upper band while moving over the VWAP line, a bull market trend is starting.
Alternatively, if prices drop below the middle line and near the lower band while being under the VWAP line, a bear market is due, and prices are falling.
Advantages and Disadvantages of VWAP Indicator
The VWAP is considered by many an accurate measure of market trends and a way to find the right entry and exit points. However, even with the most accurate volume-weighted average price calculation, this indicator still comes with some pros and cons. Let’s review them.
Benefits
- Higher accuracy: The VWAP takes into account the traded volume, making it more accurate than the MA indicator.
- Real-time tracking: The VWAP indicator reflects the current price average and is updated throughout the day for better tracking.
- Customisation: Anchored VWAP is a variation of the VWAP indicator that allows traders to track different time periods.
Limitations
- Limited to short-term trading: The VWAP resets with every new trading session, which limits its usability to track historical data.
- Lagging indicator: The indicator is lagging by nature as it reflects data after it happens, which may limit the trader’s analytics during sudden market changes.
Final Remarks
The volume-weighted average price is a technical indicator with multiple uses, helping traders confirm a certain market trend, identify the right entry and exit points and determine the correct order type.
The main function of the VWAP is to reflect the stock’s average price throughout the day, and using its line on the chart, traders can analyse price actions and make decisions accordingly.
The VWAP indicator is better used with other indicators, such as Bollinger bands and trend lines. Using these tools, traders can find and confirm whether the market is moving bullish or bearish and increase their chances of landing a successful trade.
FAQ
What does VWAP mean?
The volume-weighted average price is a technical indicator used to show the daily average price of a currency pair, stock and other financial instruments.
How is VWAP calculated?
Traders calculate VWAP first by determining the average price by dividing the high, low, and closing price by 3, which is then multiplied by the traded volume of the selected time period. The resulting number is then divided by the cumulative volume using the following formula:
VWAP = (Cumulative Average Price x Volume) / Cumulative Volume.
Is VWAP a good indicator?
The VWAP indicator is an accurate way to determine the right time to enter or exit the market. The indicator is also used to confirm market trends and identify the market order type, whether buying or selling.
Is VWAP better than EMA?
VWAP is more accurate than MA, SMA, and exponential moving averages because it factors in the traded volume, while EMA only uses historical prices divided by the selected time periods.
