What is a Fair Value Gap? A Guide to Trading Market Imbalances
June 25, 2025
The financial markets in 2025 have been defined by high volatility, much of it sparked by shifting central bank policies. For traders, this means sharp, fast-moving price action. These aggressive moves often leave behind clear ‘footprints’ in the form of market imbalances.
One of the best ways to read these footprints is by identifying a specific pattern called the Fair Value Gap (FVG). Learning to spot these zones is a key skill for understanding modern price action, and this guide will walk you through exactly how to find them, interpret what they mean, and build a strategy around them.
Key Takeaways:
- A Fair Value Gap is a specific 3-candle pattern that identifies a market imbalance, acting as a high-probability “magnet” for future price retracements and reactions.
- The core trading strategy involves entering on a retracement into the FVG, which provides a clearly defined zone for your entry, stop-loss, and overall risk management.
- The reliability of an FVG increases dramatically on higher timeframes (4H, Daily) and when used in confluence with the overall market trend, not in isolation.
What Is a Fair Value Gap?
A Fair Value Gap represents an inefficiency or imbalance in the market. It’s a zone on a chart where the price moved aggressively in one direction, leaving behind a gap that wasn’t fairly traded between buyers and sellers.
The Three-Candlestick Pattern
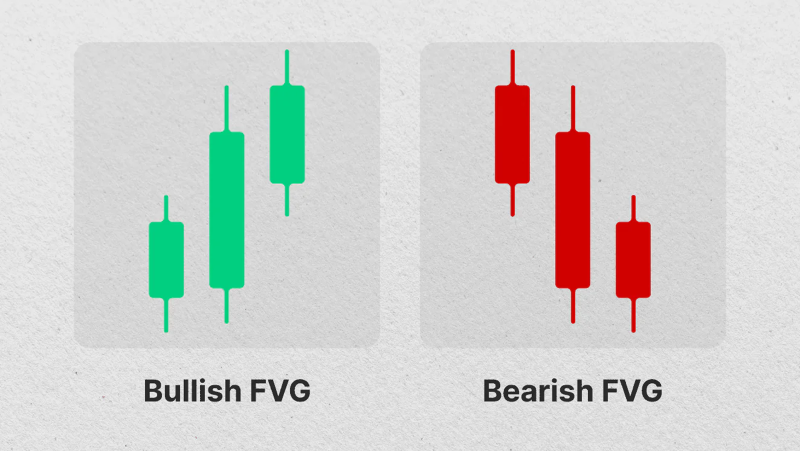
The easiest way to identify an FVG is with a specific three-candlestick pattern. This visual cue is the foundation for recognizing these imbalances on any timeframe. The pattern consists of the candle before the impulse move, the impulse candle itself, and the candle that forms immediately after it.
A bullish FVG forms during a strong upward move. It is the space between the high of the first candle and the low of the third candle. When Candle 2 moves up so aggressively that these two points don’t overlap, it creates a gap or void on the chart.
Conversely, a bearish FVG appears during a sharp downward move. This gap is the space between the low of the first candle and the high of the third candle. This area signals a strong selling imbalance that the market may try to correct later, often acting as future resistance.
What Causes a Fair Value Gap?
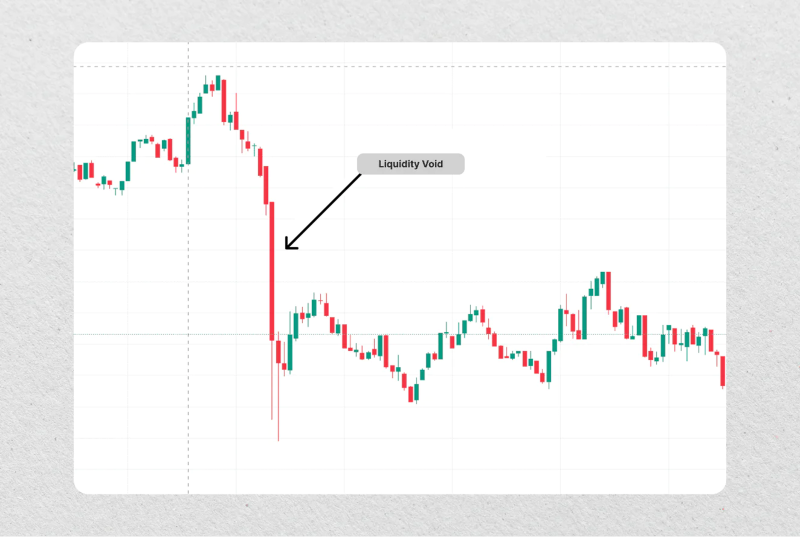
FVGs are created by an overwhelming imbalance between buy and sell pressure. When a flood of buy orders hits the market with very few sellers (or vice versa), the price moves rapidly to find the next available orders, leaving a literal gap in the order book and on the chart.
This surge of one-sided pressure is often triggered by significant events. High-impact news releases, unexpected economic data, or a large institution executing a block trade can all provide the momentum needed to create a fair value gap, as the market reprices assets in a sudden, powerful move.
Why Fair Value Gaps Matter in Trading
For a trader, a Fair Value Gap is a clear signal of a market inefficiency. These gaps highlight specific price zones that are highly likely to be revisited. This provides a clear, logical basis for forming a trading plan with a statistical edge.
Predictable Price Targets
The main reason FVGs matter is that price often returns to “fill” these gaps. Because they represent an area of one-sided liquidity, the market has a natural tendency to trade back into that zone. This makes the FVG a high-probability target for future price action.
This retracing action means FVGs function as powerful, predefined support and resistance zones. A bullish FVG below price is a logical area to watch for buyers to step in, while a bearish FVG above price is a likely zone where sellers will reappear.
A Clear Edge in Risk Management
Fair value gap trading also offers a distinct advantage in managing risk. The gap itself provides a specific, contained zone for a trade entry. This allows a trader to place a tight stop-loss just on the other side of the FVG, creating a very clearly defined risk level.
With a defined entry zone and a tight stop-loss, you can build setups with a highly favorable risk-to-reward ratio. This structure—risking a small, known amount to target a much larger price move—is the foundation of any sustainable and profitable trading strategy.
Fast Fact
For a higher-probability setup, many advanced traders wait for a “liquidity sweep” (clearing out stop-losses below a low or above a high) before entering on a retracement to an FVG.
A Practical Guide to Finding FVGs
Spotting a Fair Value Gap isn’t complicated. It really comes down to recognizing a simple three-candle pattern. Once you train your eye to see it, you’ll start noticing these imbalances everywhere, giving you a much clearer view of the market’s structure and where price might head next.
A Step-by-Step Guide
The process involves focusing on a sequence of three specific candlesticks to confirm the imbalance:
- Find the Big Move: First, look for one large, powerful candle that pushes price hard and fast in one direction. This explosive move is the key event that creates the potential imbalance.
- Look Left and Right: Now, find the candle immediately to the left of that big move (Candle 1) and the candle immediately to the right of it (Candle 3). These two candles frame the move.
- Check the Space Between Wicks: See if there’s empty space between the wicks of Candle 1 and Candle 3. If the high of Candle 1 is below the low of Candle 3, that’s a bullish FVG. If the low of Candle 1 is above the high of Candle 3, that’s a bearish FVG.
Separating Signal from Noise: Tools & Timeframe Strategy
Spotting these by eye is a great skill, but you can also use tools to save time. Trading platforms like TradingView are full of free indicators that will automatically find and draw FVGs on your chart for you, which is a huge help for quick, multi-asset analysis.

Remember that the timeframe you’re on matters a lot. A fair value gap on a daily chart is a much bigger deal than one on a 5-minute chart. The higher timeframe gap signals a more significant move by major market players, making it far more reliable as a trading signal.
Because of this, it’s smart to start by looking for FVGs only on higher timeframes like the 4-hour and daily charts. This helps you ignore the short-term noise and focus on the powerful, high-probability setups that can really define a solid trading strategy.
Trading the Imbalance: A Core FVG Strategy
Identifying a Fair Value Gap is only the first step; the real skill lies in knowing how to trade it.
Anatomy of a Basic FVG Trade
The core strategy is to wait for the price to trade back into the FVG zone after it has been created. A common technique is to enter a position as soon as the price touches the edge of the gap. More conservative traders might wait for the price to reach the 50% level of the gap for a better entry price.
Your risk on the trade is always clearly defined. For a bullish FVG trade (a long position), your stop-loss should be placed just below the low of the impulsive candle that created the gap. This gives your trade idea a clear point of invalidation if the market moves against you.
Your profit target should be set at a logical opposing liquidity level. For a long trade, this is often the nearest significant swing high. For a short trade from a bearish FVG, your primary target would typically be the nearest major swing low, creating a complete trade plan.
FVGs in Action: Examples Across Markets
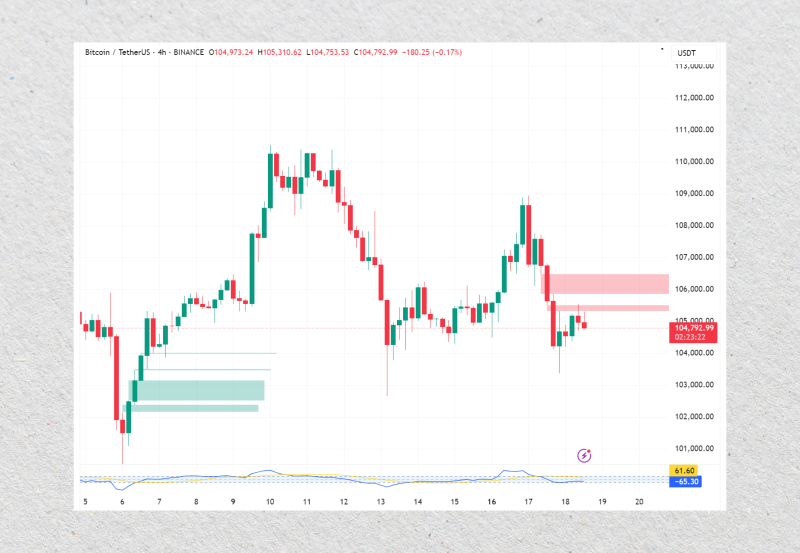
- Crypto: Imagine Bitcoin rallies hard, leaving a bullish FVG on the 4-hour chart. A patient trader would wait for the price to dip back into this FVG, enter a long position, place a stop-loss below the recent low, and target the previous swing high.
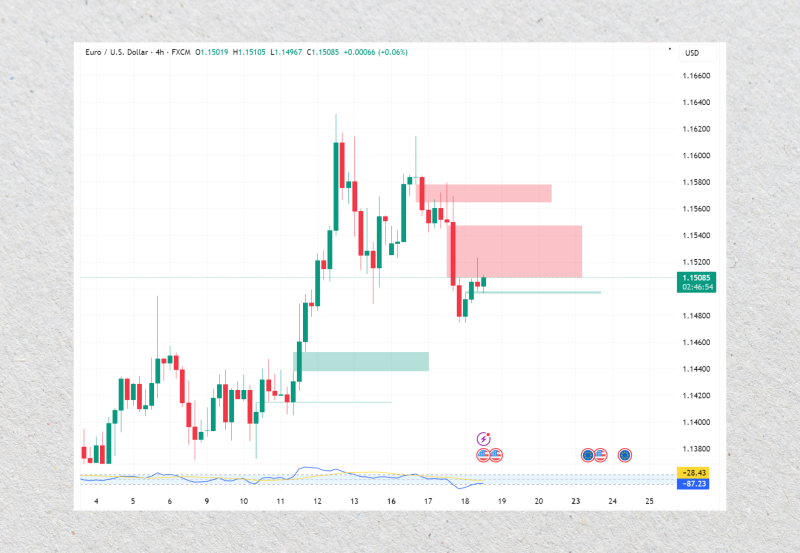
- Forex: On the EUR/USD chart, a high-impact news event causes a sharp drop, creating a bearish FVG. As the market calms and price rallies back to test this gap, a trader could enter a short position with a stop-loss placed just above the FVG’s high.
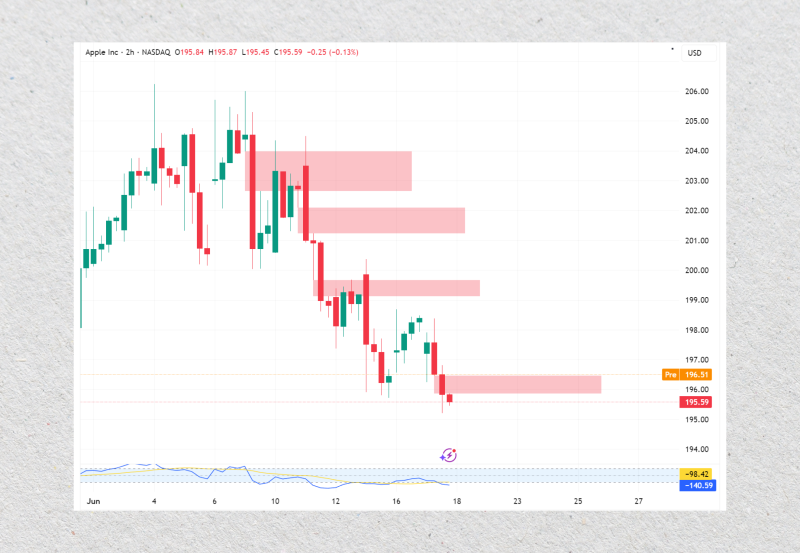
- Equities: A stock like Apple (AAPL) could gap up after strong earnings, leaving a bullish FVG far below. This gap then becomes a key institutional support level to watch on subsequent down days, offering a potential buying opportunity for traders who missed the initial move.
This core fair value gap trading strategy is powerful because of its simplicity and clear logic. By waiting for the market to show its hand and retrace to these key zones, you can execute trades with a defined risk and a high-probability outcome across any asset class.
When Support Flips: What is the Inverse FVG?
Not every Fair Value Gap holds as expected. Sometimes, price slices right through a support or resistance zone with force. This failure isn’t random; it’s a powerful piece of information. When an FVG is decisively broken, it often inverts its function, creating an advanced setup known as an Inverse Fair Value Gap (IFVG).
Defining the “Inversion”
An IFVG is created the moment price aggressively breaks through a standard FVG and closes on the other side. When this happens, the gap’s original purpose is flipped on its head. What was once a support zone becomes new resistance, and what was once resistance becomes new support.
A bullish IFVG occurs when a bearish FVG (an old resistance area) fails and price breaks cleanly above it. When price later pulls back down to this zone, traders now watch it as a high-probability support level to buy from, aligning with the new upward momentum.
Conversely, a bearish IFVG is formed when a bullish FVG (an old support area) is broken to the downside. After this breakdown, the zone now acts as a strong resistance level. Traders will look for opportunities to sell when price rallies back up to retest it.
The Strategic Power of an Inverse FVG
The most important message an IFVG sends is that the underlying market trend is likely shifting. The failure of a key support or resistance zone to do its job is a clear signal that the dominant order flow has changed hands from buyers to sellers, or vice versa.
This allows traders to operate within a simple premium and discount framework. After a bearish trend shift is confirmed by an IFVG, for example, a trader can wait for price to rally to a “premium” price at the IFVG level to enter a short position, following the new, confirmed trend.
This is why trading an inverse fair value gap is often considered a higher-probability setup. You are no longer just anticipating a reaction at a level; you are trading in the direction of a confirmed shift in market structure, which adds a powerful layer of confluence to your trade idea.
Trading with Realism: FVG Risks & Limitations
No single tool in trading works every time, and the Fair Value Gap is no exception. Understanding the limitations of FVGs is just as important as knowing how to find them. This realistic approach is essential for protecting your capital and building a sustainable trading plan over the long term.
Common Failure Scenarios
First, understand that the market is not obligated to fill every gap. In a very strong, one-sided trend, price can create an FVG and simply continue on its path, leaving traders waiting for a retracement that never comes. An FVG is a point of interest, not a guaranteed event.
Additionally, price can sometimes dip into an FVG just enough to trigger entry orders before sharply reversing and hitting stop-losses. This is why trading an FVG in isolation, without any other confirming signals, can be a risky and often frustrating endeavor for many traders.
Trading with Confluence
The key to overcoming these limitations is confluence. An FVG becomes a much higher-probability signal when it aligns with other technical factors on your chart. Never trade a fair value gap in a vacuum; always look for multiple reasons to support your trade idea before you enter.
The most important factor is the overall market trend. A bullish FVG is far more likely to act as strong support in a clear uptrend. Conversely, trying to buy from a bullish FVG in an established downtrend is a low-probability trade that is much more likely to fail.
Finally, even the best FVG setup with perfect confluence can fail. This is why disciplined risk management is non-negotiable. Always use the clearly defined stop-loss discussed earlier and never risk more than a small, fixed percentage of your account on any single trade idea.
Final Thoughts
A Fair Value Gap is a direct signal of market imbalance, showing you exactly where institutional momentum has left its mark. Its predictive power, however, depends entirely on context. The most reliable FVG setups are always those that align with the higher timeframe trend and your overall trading plan.
Mastering this concept isn’t theoretical; it comes from disciplined screen time and practice. Test these setups, track your results, and adapt what you’ve learned to your own style. This hands-on work is what turns a simple pattern on a chart into a real, functional trading edge.
Disclaimer: This article is for educational purposes only and should not be considered financial advice. All trading involves significant risk.
FAQ:
What is the best indicator for fair value gaps?
There is no single “best” official indicator, as FVGs are a price action concept identified visually. However, platforms like TradingView offer many free community-built indicators that automatically draw these zones on your chart, which can significantly speed up your analysis.
What time frame is best for fair value gaps?
Higher timeframes, such as the 4-hour, daily, and weekly charts, are generally best for identifying reliable fair value gaps. An FVG on a higher timeframe represents a more significant institutional imbalance and is less likely to be simple market noise.
What is the difference between bearish and bullish fair value gap?
A bullish fair value gap is an imbalance created during a strong upward price move, which often acts as a future support zone. A bearish FVG is the opposite; it is formed during a sharp downward move and typically acts as a future resistance zone.
