What is a Doji Candle: Explaining Types and Trading Strategies
July 03, 2024

Having a clear grasp of the candlestick chart is imperative for understanding market dynamics and making sound trading conclusions. Recognizing the significance of candlestick models, such as the Doji, is crucial in technical analysis for deciphering market sentiment and forecasting potential price shifts.
Derived from a Japanese term meaning “error,” they illustrate a market in a “watch and see” phase. They provide crucial information about unsteady prices, market volatility, and conceivable trend shifts in various sectors.
In this article, we will discuss what is a Doji candle formation, how it is formed, and how traders can use it to boost their trading experience.
Key Takeaways:
- A Doji candlestick pattern is formed when the market’s open and close prices are nearly the same.
- There are five common types of Doji stars: neutral, dragonfly, gravestone, long-legged, and 4-price.
- Using Doji on its own does not contribute to a strong signal, so it’s important to have a stop loss in place and confirm any likely move.
- You can use Doji candles in various trading strategies, such as Double Doji or Doji and Trend Line.
Defining Doji Candle
When the market opens and closes at almost the same price, a Doji candle, also known as the Doji star, is formed. It is identifiable by its small body and long wick that looks like a cross. This pattern results from buyers pushing prices higher and sellers pushing them lower.
The candlestick lacks a visible body due to the wicks formed by the opening and closing movements. Doji candles often signal a lack of market confidence or a weakening trend.
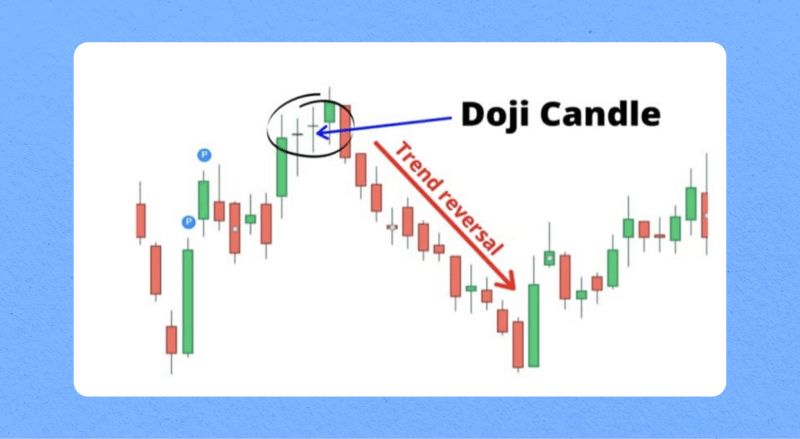
Traders have historically relied on Doji stars to predict the market’s peaks and troughs, indicating a weakening upward trend. However, a trend reversal is not always indicated by the Doji pattern, and additional technical indicators like the relative strength index (RSI) and Bollinger Bands can provide additional significance to it.
The Doji star is a crucial indicator for Forex traders, providing a “pause and reflection” moment. If the market moves higher, it may indicate a slowing buying or selling momentum. Traders should consider this candle formation with a technical indicator or exit strategy and exit trades only if they confirm Doji’s suggestions. It’s fundamental to conduct a thorough analysis before closing a position, as the market may pause briefly before continuing the trend.
Doji Candle Types
A Doji candlestick model is a transitional formation that doesn’t indicate the continuation or reversal of the trend. There are four distinct patterns of a Doji candle.
Neutral or Common
A neutral or common Doji pattern is a unique price chart appearance of any color with a nearly undetectable real body and equal upper and lower shadows, indicating a balanced market. It can be combined with momentum indicators like the RSI or MCD to identify potential market tops and bottoms. To identify a neutral Doji, look at whether it forms in a downswing or upswing as part of another arrangement.
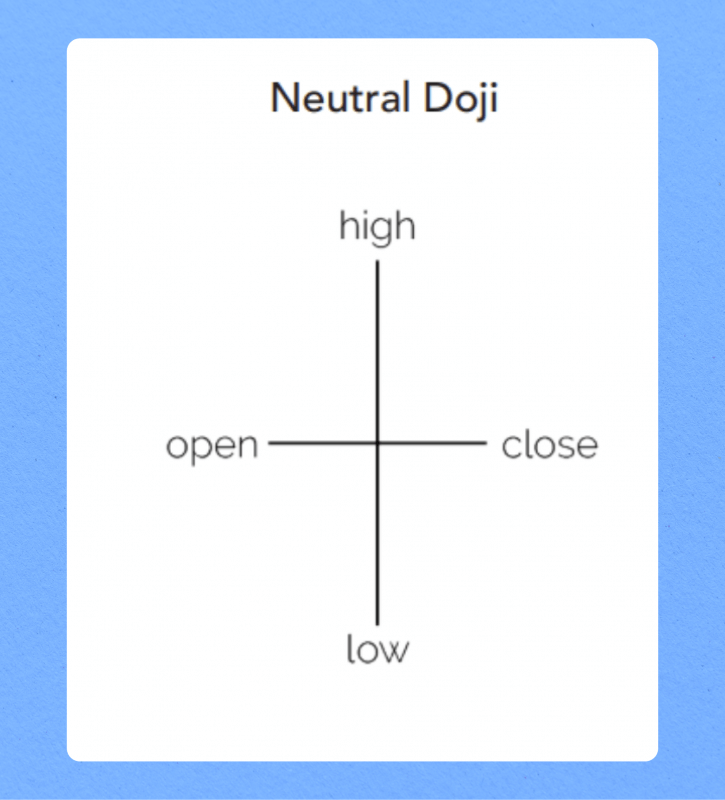
It can form after an upswing or downswing, depending on the context. The pattern can be advancing (white or green) or falling (black or red), depending on the closing price. A bullish Doji forms at the bottom of a downward price swing, implying that bears are losing control, and a bearish Doji forms at the top of an upward price swing, indicating bulls are losing control. Both Doji patterns can signal market reversals when they occur in the right context, forming a multi-candlestick reversal model.
Dragonfly
Dragonfly Doji is a pattern with no real body and a long downward shadow that creates a “T” shape. The pattern indicates a potential price reversal to the downside or upside.
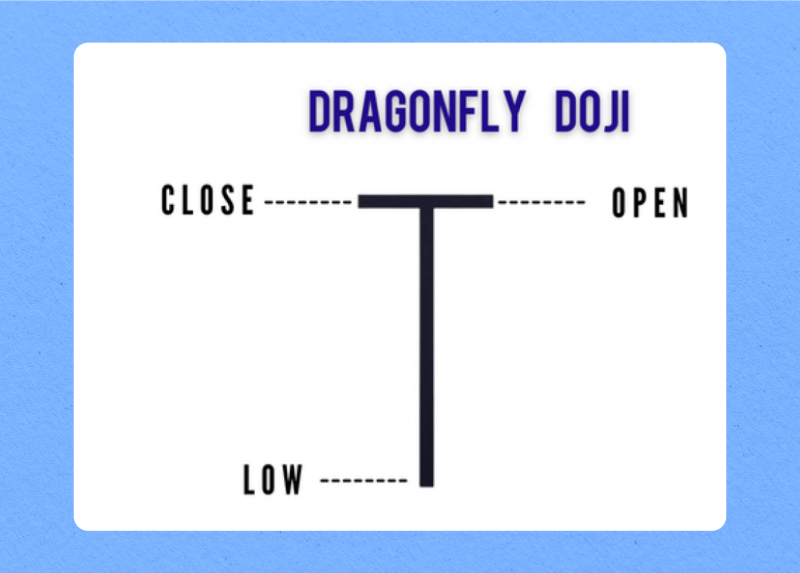
The color of a Dragonfly Doji does not matter, as the opening and closing prices have a close resemblance. However, red Dragonfly Dojis form when the closing price is slightly less than the opening price, demonstrating that the bears dominate the market by a small margin. Green Dragonfly Dojis form when the closing price of a stock is higher than the opening price, signifying that the bulls are still somewhat confident in continuing their positions.
A Dragonfly Doji is a reliable sign of a trend reversal when it appears at the bottom of a downtrend, as the price reaches a support level during the trading day, suggesting that the market’s sellers are no longer outnumbering the buyers.
Long-Legged
The long-legged Doji candlestick pattern is an arrangement where an asset’s opening and closing prices are close or equal, resulting in a small or non-existent real body with long upper and lower shadows and any color, either bull or bear. This indicates significant price movement during the trading session, but the market closed near its opening price. This pattern signifies sharp price fluctuations but a consistent price level, indicating indecision between buyers and sellers, making it more dramatic than the common Doji.
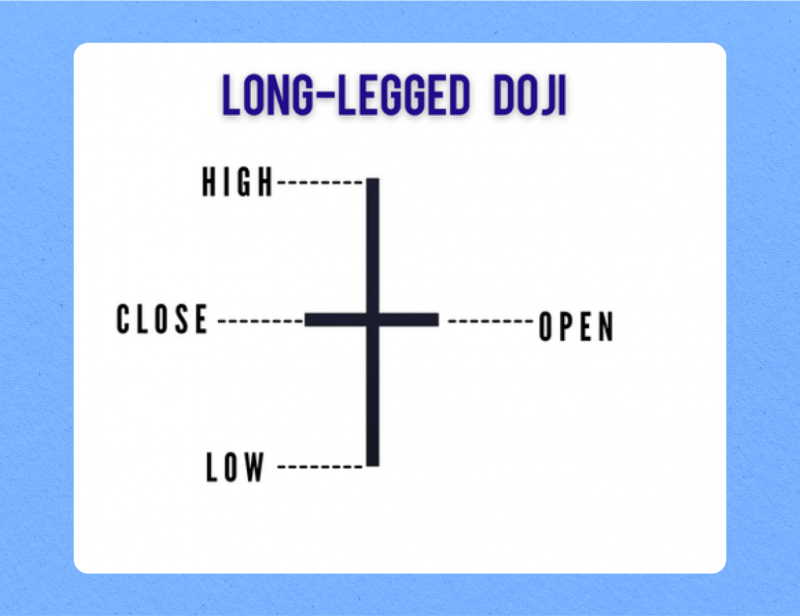
This pattern can form after an upswing or downswing and is typically found in a shaky market, exhibiting indecision between buyers and sellers during the trading session. To identify a long-legged Doji design accurately, consider the market context, whether it forms in a downswing or upswing, and as part of another pattern.
The candle’s inverted cross shape suggests that neither bulls nor bears were in control. However, it could signify a pause in price momentum. If it occurs at the bottom of a downward price swing, it may signify the end of bearish momentum, suggesting a price reversal. If it occurs at the top of an upward price swing, it may indicate the end of the bull’s momentum, suggesting a bearish reversal. However, a long-legged Doji alone is not a strong indication of a potential reversal.
Gravestone
The Gravestone Doji candle is a single-candle formation, representing an inverted “T” shape. Its long upper shadow is created when the asset opens and closes at nearly the same price, forming a slim real body. The price trades much higher intraday before closing near the open, resulting in a tall upper wick reflecting intense selling pressure.
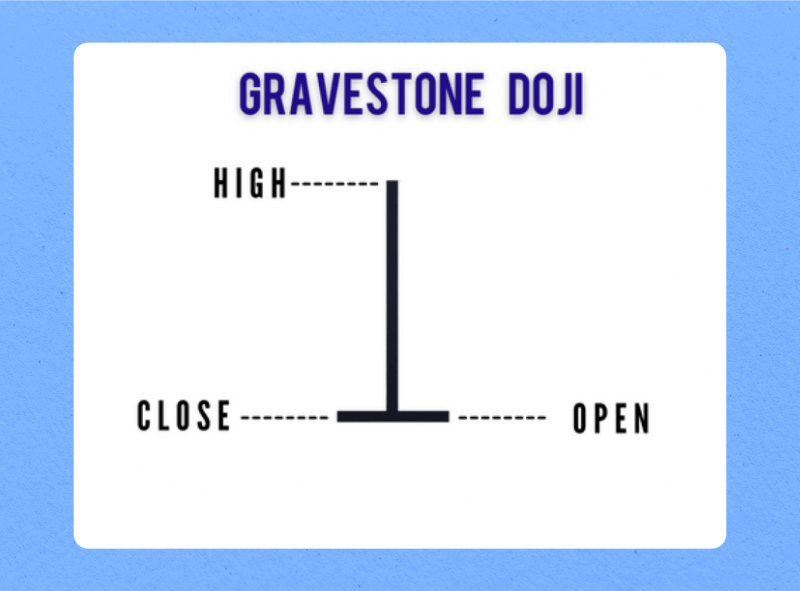
This unique star indicates buyers attempted to increase prices but couldn’t maintain momentum. The Gravestone Doji’s appearance often precedes a trend reversal or pullback after an extended uptrend. Its ominous name refers to how the star resembles a tombstone, portending the “death” of the prior advance. When confirmed by volume or subsequent price movement, the Gravestone Doji prompts traders to secure profits on long trades or initiate new short positions in anticipation of a potential drift lower.
To confirm the pattern’s validity, traders check for supporting technical indicators like rising volume or overbought signals. Once verified, the formation prompts positioning for a bearish reversal over subsequent sessions.
4 Price
The 4-Price Doji is a pattern consisting of four consecutive Doji stars. It emerges when the open, close, high, and low are the same, creating a single line on the chart. This arrangement lacks a body and wick, appearing only as a horizontal line with no price fluctuation for the day, representing indecision and a lull in the market.
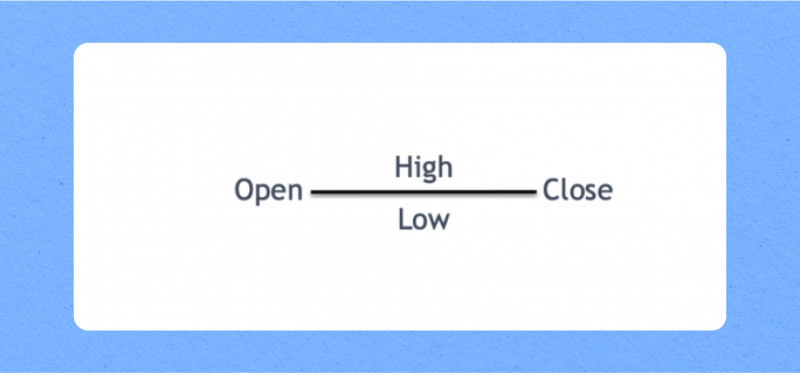
This shape suggests a significant level of indecisiveness in the market, with neither buyer nor seller gaining control. Traders interpret this as a sign of potential trend reversal or consolidation. It could indicate a market turning point, with a breakout in either direction. To make healthier trading decisions, traders should consider other factors such as the overall trend, volume, and support/resistance levels, as well as other technical markers or patterns.
How to Trade with Dojis
The Doji candlestick pattern is a useful market signal for gauging buyer-seller indecisiveness. It signals a possible impending reversal, offering a sign of indecision that precedes a change in direction.
The appearance of a Doji star suggests hesitancy among market participants about the potential outcomes in the currency market. This indicates a lack of leadership, leaving both buyers and sellers unsure of how to proceed.
Doji candles assist in trading by indicating potential trend shifts and validating signals from other indicators. They are useful for highlighting market fluctuations and trajectories. They can also be utilized to validate levels at which the price is anticipated to increase or decrease.
To use Doji candlestick patterns, traders should wait for the next candle or combine them with other indicators to get a better signal. If a Doji candle forms in key support areas, it could signal a bull’s trend reversal, and traders can place buy orders slightly above the highest price.
However, a Doji on its own isn’t necessarily a strong signal, so it’s important to have a stop loss in place and confirm any likely move. To set your stop loss, find a nearby level of support or resistance and place it just beyond it. To confirm a Doji trade, wait for a couple of periods before opening a position.
Doji aren’t hugely strong signals, so consider using them as part of a wider confirmation strategy. Some traders use technical analysis tools or stochastic oscillators to find opportunities first, then look for a Doji as an extra sign of momentum switching.
These shapes are best for trading in one-hour and longer timeframes due to their frequent appearance and lack of serious signals for price movement. In short-term trading, take profit at the nearest support levels, while more patient traders can wait until the price tests the resistance trendline.
Examples of Trading with Doji Candle Strategies
Traders employ various strategies for trading candlestick formations, but all utilize the Doji candle solely for confirmation. Here are some examples of Doji star strategies that can be profitable.
Doji and Trend Line
Doji trading schemes often occur near key points of resistance and support. A dragonfly Doji emerging near the trendline’s support indicates a potential bull signal due to the candlestick shape, which indicates the retracement of low prices.
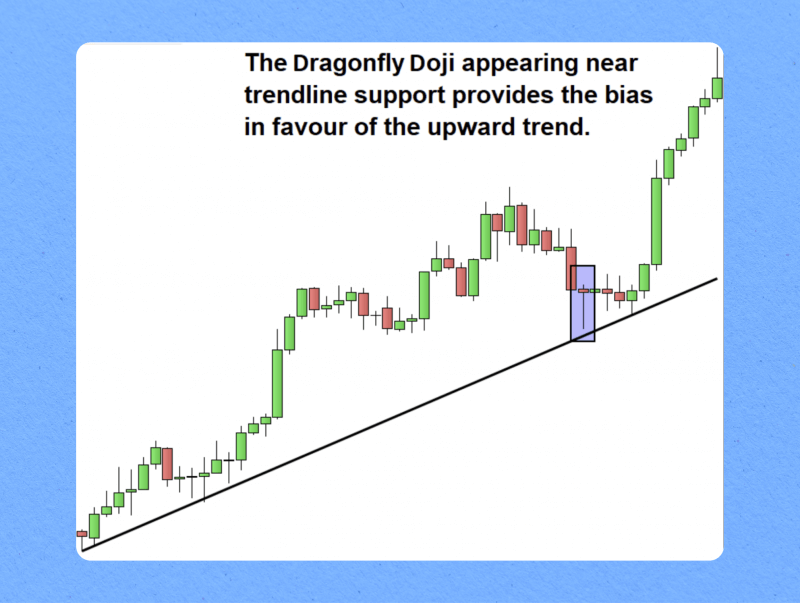
The Dragonfly Doji suggests a bulling bias in the market. It appears near trendline support, suggesting a rejection of lower prices and subsequent upward movement. This bias is supported by Doji’s proximity to trendline support, which has previously bounced off this significant trendline, allowing traders to trade based on the market’s underlying trends.
Double Doji Strategy
The Double Doji strategy is a trading strategy that focuses on identifying strong breakouts after periods of wavering. Traders can wait for market movement after the Doji, with entry points below the low and stops above the highs. Targets can be placed at recent support levels, but breakouts with increased momentum may run for an extended period, so a trailing stop is recommended.
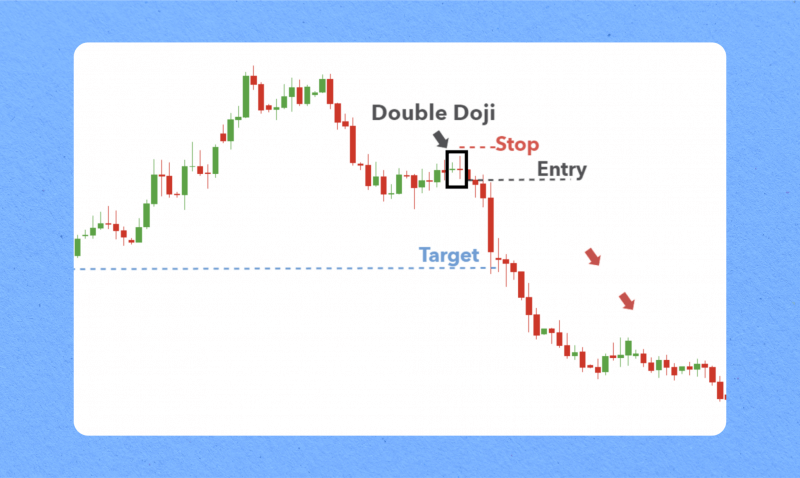
The Double Doji Candle pattern offers priceless insights into probable reversions and can be used as a trading strategy. By identifying consecutive Doji stars in a chart, traders can confirm the market’s inclination, pinpoint key support and resistance levels, and place pending orders if the pattern is identified. A stop-loss order can be set to manage risk, with buy orders placed below the low and sell orders above the high.
To manage the trade, traders can use three methods: set the take-profit level equal to the stop-loss level, open two identical trades with a higher take-profit level, or close one trade and close 80% of the position when the price reaches the first take-profit level.
The remaining 20% of the position can be left open and set the take-profit level twice the size of the stop-loss. This strategy can help maximize trading opportunities and ensure a 1:1 risk-to-reward ratio for traders.
Final Takeaways
Traders find Doji candle patterns significant as they offer insight into market behavior and can assist in making trading decisions. These formations reveal market uncertainty and can signal potential price movement in either direction. It occurs when bullish traders increase prices and bear traders decrease them. Exploring these patterns assists traders in earning success and capitalizing on valuable prospects.
However, Dojis should not be used as a sole indicator; the surrounding context, such as trend, volume, and other technical indicators, must also be considered. Successful trading also requires prioritizing risk management, setting appropriate stop-loss levels, and continuously practicing.
FAQs
What is the meaning of the Doji candlestick?
Doji stars signal a potential reversal in security price trends, prompting traders to pause and reflect before making investment decisions.
Is a Doji candle bulling or bearing?
The Doji is a neutral pattern, signifying a bullish or bearish reversal depending on its variety and location. However, in the context of a market on the rise, its presence signifies a substantial shift towards a market downturn.
Is the Doji pattern trustworthy?
Doji candlesticks, as neutral ma, provide limited insight and are not reliable for predicting price reversals due to their low prevalence.
What is the Doji candle strategy?
One popular Doji trading plan applies Dojis arising near support and resistance levels. A dragonfly Doji near trendline support signals a retracement of low prices, potentially indicating a bullish signal near a support area.


