Megaphone Pattern: What Is It? How to Use It In Trading
Mar 29, 2025
Excelling in the financial markets requires advanced knowledge of indicators, charts, and trading signals to make accurate decisions and optimize market entry.
One way to time your entry or exit is to use the megaphone chart pattern. It is a popular chart for locating possible price breakouts and potential dips. It signifies price volatility and indecision periods, making it easier to determine uptrends and downtrends.
Key Takeaways:
- The megaphone pattern is created as the market price swings on both ends.
- The chart pattern forms as volatility, trading volume, and market uncertainty increase.
- If the megaphone shape is followed by an upward breakout, it suggests a long position.
- If the chart pattern is followed by a downward-breaking trendline, it suggests a short position.
Understanding The Megaphone Pattern
The megaphone pattern is a chart pattern where price swings widen over time, forming a megaphone shape. It occurs due to increasing volatility and uncertainty, reflecting an ongoing rally between market participants.
The pattern consists of higher highs and lower lows, with trend lines diverging further from each other. This alignment often signals a potential breakout in either direction.
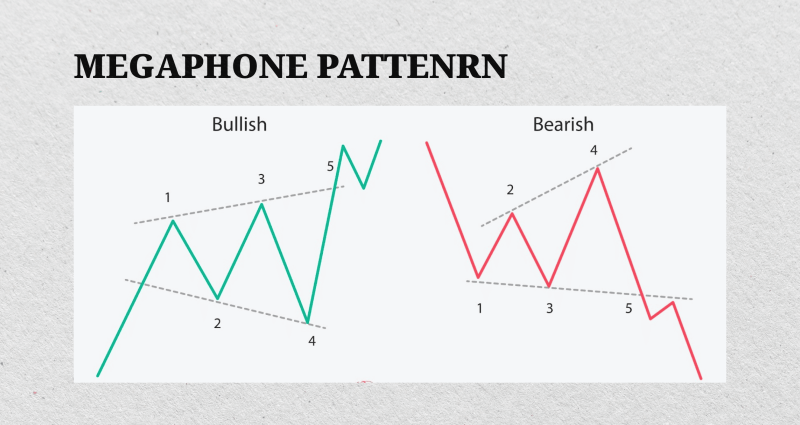
Traders use it to anticipate strong price movements and adjust their strategies accordingly. While it can appear in any market, it is most useful when price action becomes inconsistent, suggesting an upcoming trend shift or continuation in the same direction.
Where to Use The Megaphone Chart?
The megaphone trading pattern is commonly used in equity, Forex, commodity, and cryptocurrency markets, especially when volatility levels spike.
It often emerges during major economic events, earnings reports, interest rate decisions, political uncertainty, or blockchain breakthroughs regarding crypto trading.
This pattern is useful in trending markets where price fluctuations become exaggerated before a breakout. Swing traders use it to trade price oscillations as the trendline bounces off both ends, while breakout traders wait for the price to breach the upper or lower boundary.
Therefore, it is crucial to understand market conditions, liquidity changes, and trading volumes to confirm breakouts and predict trajectories that can lead to significant price moves in either direction.
Key Characteristics
Chart trends and lines can be similar, and it is easy to confuse the megaphone with other bullish or bearish chart patterns. Therefore, it is vital to find key characteristics to prepare for potential price movements. These are:
- Diverging Trend lines: The pattern forms as prices continuously make higher highs and lower lows to form an expanding structure.
- Increased Volatility: The price range widens as the trend continues, indicating growing market uncertainty.
- Five Swings Minimum: A valid megaphone pattern consists of at least two higher highs, two lower lows, and one additional swing.
- Potential Breakouts: The pattern often leads to a strong breakout in either direction.
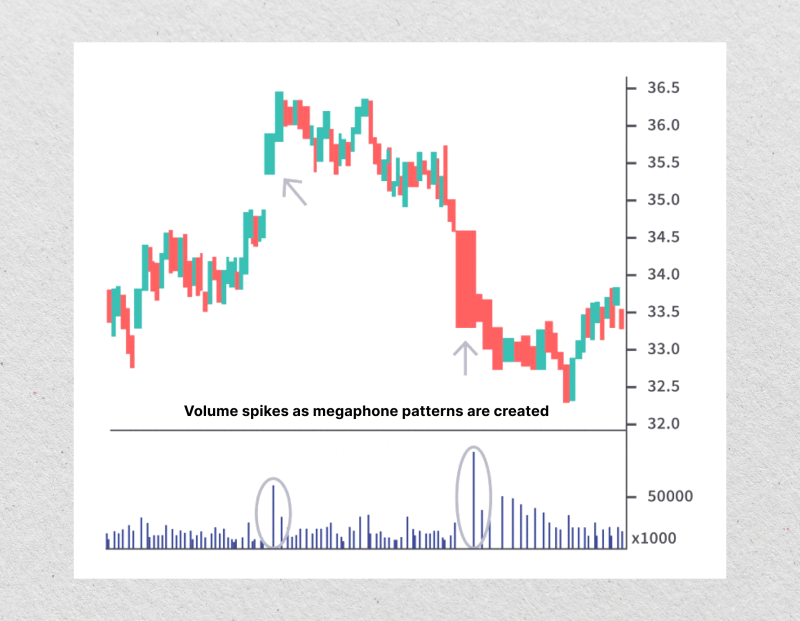
- Volume Fluctuations: Trading volume tends to rise before a breakout, confirming its validity.
Rising Megaphone Pattern (Bullish Markets)
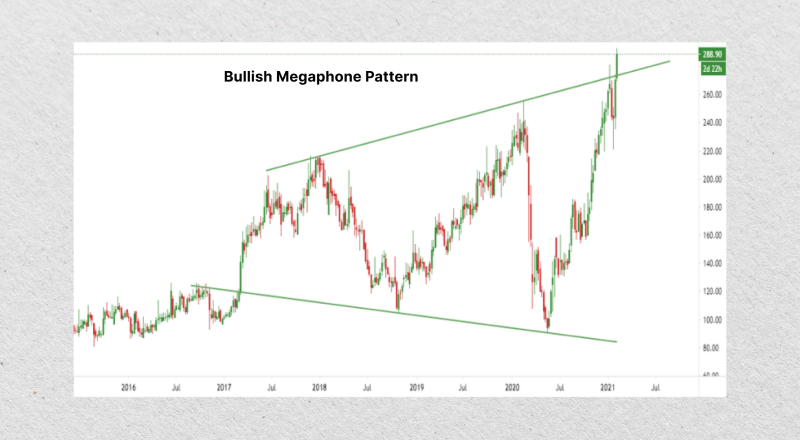
An upward megaphone chart pattern appears in bullish markets when the price makes higher highs and lower lows within expanding trend lines. This pattern signals increasing volatility but still maintains an overall upward direction.
A confirmed breakout above the upper trendline suggests strong bullish momentum and provides an entry point for trend-following traders. Additionally, confirming volumes is crucial, as increasing volume breakouts indicate stronger price continuation.
How to Trade?
This trend represents opportunities to buy near the lower line and sell near the upper trend line.
- Use the moving averages indicator to confirm trend strength before entering a long position.
- Place stop-loss limits just below the most recent swing low to minimize losses because false breakouts can occur.
- Use the Relative Strength Index (RSI) indicator to confirm overbought or oversold conditions before entering a trade.
While a rising megaphone pattern signals a potential continuation of an uptrend, caution is necessary. A reversal may occur if the price fails to stay above resistance and falls back into the pattern. Therefore, you can wait to retest the breakout level before entering the market to confirm the pattern’s validity and improve trading accuracy.
Failed Megaphone Pattern (Bearish Markets)
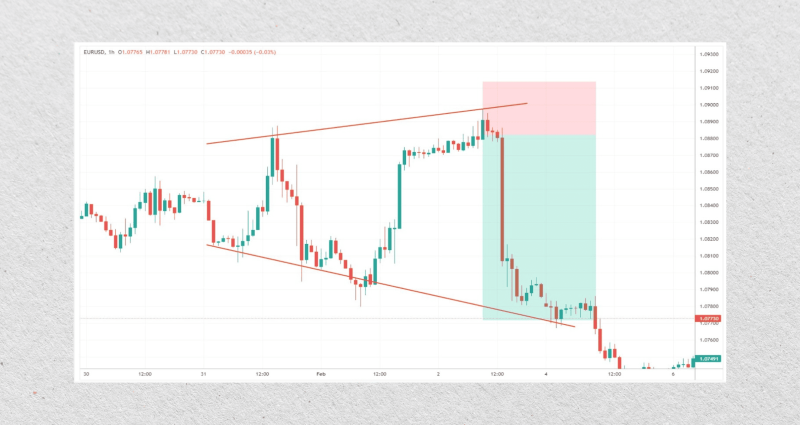
A downward megaphone pattern occurs when the price fails to break out upward and falls below the lower trendline. This signals a bearish reversal and often leads to sharp declines as selling pressure increases.
This happens when prices make lower highs and struggle to maintain higher lows. During these bearish moments, the price breaks down below the lower trendline with an increased volume.
How to Trade?
This represents opportunities to take short positions at this stage as the bullish megaphone pattern weakens and bears take over, leading to a shift in trend direction and a further downside movement.
- You can place stop-loss limits above the most recent high swing to protect against sudden reversals.
- Use the Bollinger Bands to confirm the breakdown and highlight continued price action.
- Use the MACD indicator as it crosses below the signal line, suggesting an increasing bearish momentum.
A failed megaphone pattern is a strong bearish signal, but you must be careful of false breakdowns. If the price briefly moves below support but quickly rebounds, it can trap short sellers. Therefore, you may wait for sustained price action below the trendline to optimize accuracy and reduce the risk of false signals.
3 Trading Strategies for Megaphone Chart Pattern
You can take advantage of the megaphone pattern with different trading strategies, benefiting from volatility and market indecision. The three most common approaches are swing trading, breakout trading, and mean reversion.
These megaphone pattern trading strategies require careful risk management to avoid false signals and maximize profit opportunities. Here’s how you can use them.
Swing Trading
This strategy relies on the megaphone pattern to trade price swings between support and resistance levels. In an uptrend, you can buy near the lower trendline and sell near the upper trendline, while in a downtrend, you can short at resistance and buy at support.
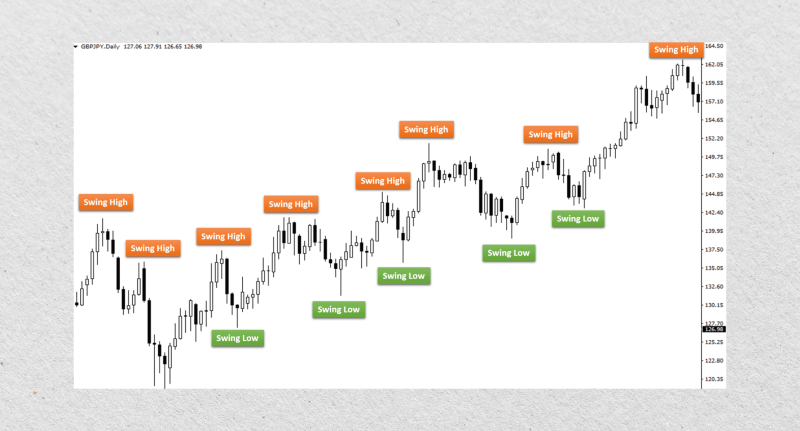
Swing trading works best in volatile markets where price consistently bounces between trend lines. Stop-loss orders should be placed just beyond the trend lines to protect against unexpected breakouts.
You can combine it with RSI and Bollinger Bands indicators to identify overbuying and overselling zones, improving the entry accuracy.
Breakout Strategy
This strategy focuses on entering trades when prices move beyond the megaphone pattern’s boundaries and prepare to form a new trend. You can buy when the price breaks above the upper trendline with strong volume or short when the market breaks below the lower trendline.
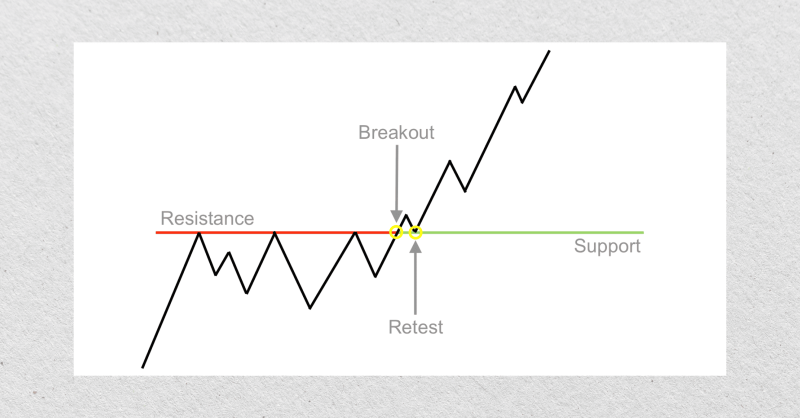
To avoid the false breakout risk, you can wait for a confirmed breakout with high volumes before entering trades or retest the breakout level to ensure a safer entry.
Stop-loss orders should be placed inside the pattern to limit potential losses while moving averages and volume indicators help verify breakout strength and accuracy.
Mean Reversion
The mean reversion strategy suggests that prices will return to average after moving toward extreme levels within the megaphone pattern. Trading with this strategy requires entering a long position near the lower trendline and short near the upper trendline, aiming for the price to revert toward the midpoint.
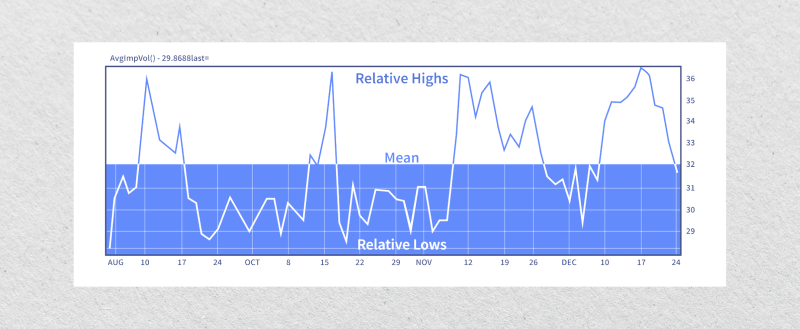
However, the price line can extend beyond expected levels before reversing. Therefore, you can place stop-loss orders beyond the outer trend lines to minimize losses.
Technical Indicators You Can Combine
The megaphone chart pattern alone can be inaccurate. Therefore, you can combine it with multiple technical indicators to increase trading accuracy and minimize the risk of false signals and reversals.
- Relative Strength Index: The RSI indicator helps identify overbought and oversold zones. If the RSI score crosses above 70, it signals potential selling pressure, while if it drops below 30, it hints at a buying opportunity.
- Bollinger Bands: This indicator measures price volatility. When prices touch the upper band, it indicates overbuying, while touching the lower band suggests overselling.
- Moving Averages: Short-term and long-term MA lines help confirm trend direction. A bullish crossover suggests upward momentum, while a bearish crossover indicates potential declines.
- Volume Oscillator: Volume indicators help confirm breakouts by analyzing changes in trading activities. A rising oscillator indicates strong breakout momentum, while declining volume suggests a potential false breakout.
Fast Fact:
In some cases, the megaphone pattern forms due to institutional manipulation or trading strategies, where large players create artificial volatility before driving the price in their desired direction.
Advantages and Disadvantages
The megaphone pattern is a powerful tool for traders looking to capitalize on market volatility. However, like any trading strategy, it has its strengths and weaknesses that you must consider to make informed decisions and manage risks effectively.
Pros
- Identifies Breakouts Early: It helps traders spot potential breakout points before major price moves.
- Versatile Across Markets: The megaphone pattern is applicable in stocks, Forex, commodities, and crypto trading.
- Multiple Trading Opportunities: It suits different trading styles, including swing trading, trend trading, and breakout strategies.
- Risk Management Levels: It provides traders with clear trend lines that determine entry, exit, and stop-loss zones.
- Enhances Market Timing: It helps anticipate trend reversals, price breakouts, and market turning points.
- Complements Technical Indicators: The megaphone chart works effectively with RSI, moving averages, and volume analysis.
Cons
- High Volatility Risks: Sudden price swings can lead to significant losses if not managed properly.
- False Breakouts: Prices can unexpectedly reverse after temporarily breaching the trend lines, leading to failed trades.
- Difficult for Beginners: The widening price action can be confusing for new traders, especially in highly volatile markets.
- No Directional Certainty: The pattern does not always indicate whether the breakout will be bullish or bearish.
- Requires Strong Discipline: Traders must wait or use other measures for confirmation of a trend to avoid premature orders.
- Time-Consuming: The complete megaphone pattern takes time to form, which may not suit short-term traders.
Conclusion
The megaphone pattern is a versatile technical analysis tool that helps navigate volatile markets. It provides opportunities for swing trading and breakout strategies to capitalize on trends on both sides of the market.
However, it must be implemented with careful risk assessment because of its unpredictable nature and the possibility of false signals. You can combine your analysis with indicators like RSI, moving averages, and Bollinger Bands to enhance trade accuracy.
FAQ
What happens after a broadening formation is created?
After a megaphone pattern is shaped, the price typically experiences a strong breakout in either direction. If the breakout is bullish, you can open a long position; if it is bearish, you can place a short market order.
How do I trade a megaphone pattern?
Trading a megaphone pattern involves buying near support and selling near resistance for swing trades or waiting for a breakout to enter a position. Use indicators like RSI and volume to confirm trends.
Is the megaphone trading pattern suitable for beginners?
It can be challenging for beginners to trade with this chart due to its high volatility and unpredictable breakouts. However, with proper risk management and proper usage of technical indicators for confirmation, new traders can learn to trade it effectively.
Can you use the megaphone chart pattern in crypto markets?
Yes. The megaphone pattern works well in the crypto market due to its high-volatility suitability. Cryptocurrency prices fluctuate frequently, making this pattern useful for identifying and capitalizing on potential price movements.
