What is Fear and Greed Index and How to Analyze It
Apr 26, 2024
Thanks to the digital revolution, investing has become widely available to the general public. You no longer need a bachelor’s degree and years of accumulating knowledge and experience to start trading in stocks, forex, crypto, or other markets. The availability of information has become global, with every individual having the chance to learn the basics of investment.
However, this doesn’t mean that becoming a successful trader in financial markets is any more accessible than before. On the contrary, investing has become more saturated and riskier than ever, making it essential to learn the fundamentals.
One such crucial concept is the Fear and Greed Index, which allows investors to understand investor sentiment without making complex calculations. This piece will discuss how the Fear and Greed Index works and how you can leverage it for more optimal trading.
Key Takeaways
- The Fear and Greed Index was created by CNN Business to gauge market sentiment.
- The F&G index showcases the general market momentum, with assets being either overpriced or underpriced.
- The F&G index is calculated from seven different market indicators that each asses market momentum.
- F&G is essential for investors, brokers, and traders, regardless of their industry.
Defining the Fear & Greed Index
The Fear and Greed Index was invented in 2012 by CNN’s business branch. It aims to create an ultimate indicator to analyze market sentiment without confusion. The index’s purpose is to give investors a quick overview of stock price momentum, letting them assess the current market price action efficiently.
It is no secret that asset markets are susceptible to irrational decisions, emotionally driven price action, and inefficiency. In many cases, investors become either too greedy or too conservative with their decisions, driving the market to enter a bull run or a crisis.
Without the Fear & Greed index, individuals had to asses numerous indicators to derive the same point. While this process was easy for industry professionals and top performers, average individuals would have a lot of problems with complex calculations.
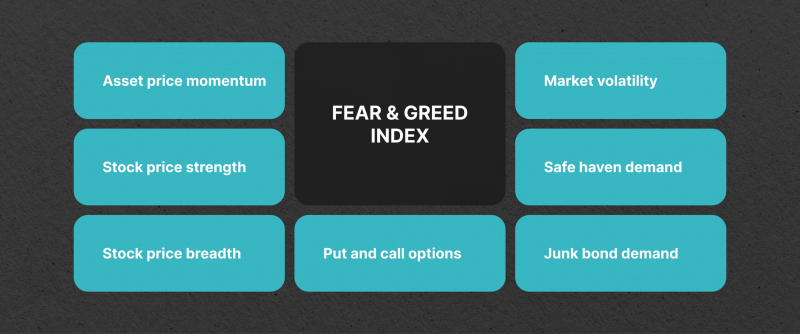
CNN’s Fear vs. Greed Index presents an effective ratio that can be easily analyzed and incorporated into your daily activities. The Fear and Greed Index is a mix of numerous different concepts that combine seven different market indicators.
As a result, this ratio is well-balanced and has been proven as an optimal assessment of market sentiment. Naturally, it is not enough to follow only the F&G index, as it does not showcase the finer details of price action and is too vague to make any final commitments as a trader.
How to Read the Fear & Greed Index
The fear greed index is a 0-100 ratio that can be clearly understood and digested even by newcomer traders. In general, the F&G index can be divided into five sections. The 0-24 range represents excessive fear, where stocks and other tradable assets are generally undervalued due to a pessimistic sentiment from investors. 25-44 showcases moderate fear level, with traders being cautious but not devaluing assets beyond rationality.
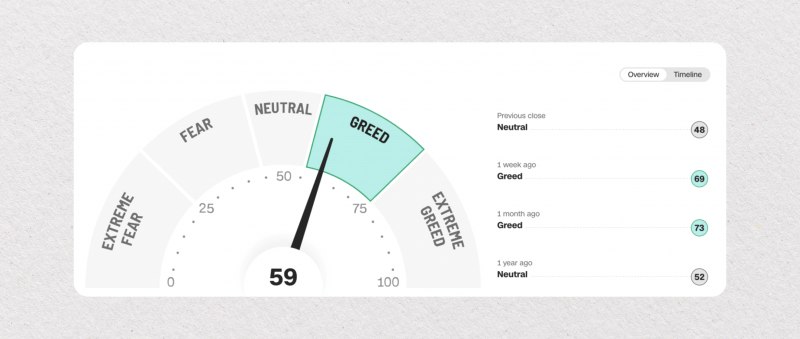
45-55 shows a relatively neutral market, where the assets are not suffering from a massive crisis or experiencing unusual hype. 56-75 is a range where traders and investors become greedy, hyping up the asset beyond its fair value due to aggressive price action. However, this range is still within reason and could be a great time to invest in a particular asset.
Finally, anything above 76 represents extreme greed, with traders driving up stock market prices beyond reasonable expectations. The above-76 range is where most irrational decisions happen due to overly aggressive investment decisions. In many cases, this range could signal an upcoming bubble, driving the stock prices in the direction of unsustainability.
How F&G is Calculated
While knowing the inner workings of the greed and fear index is not mandatory, investors should have a basic understanding of how this ratio works. As a result, you can tell which index has more sway when the F&G index is driven in a particular direction.
Asset Price Momentum
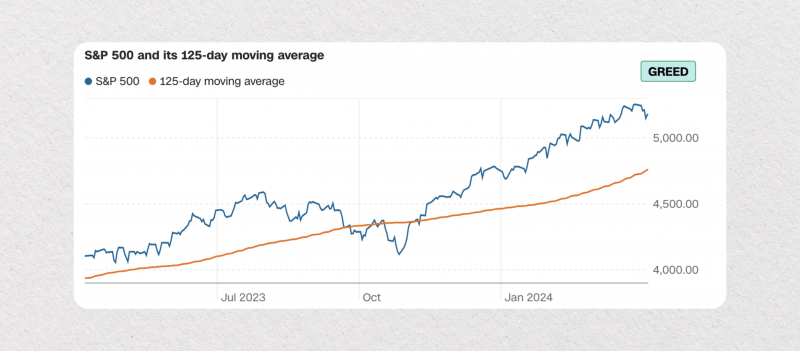
The price momentum evaluates the S&P 500’s figure compared to the 125 moving average of the market. If the current figure is higher, the market is leaning in a bullish direction. The same is true in reverse.
Stock Price Strength
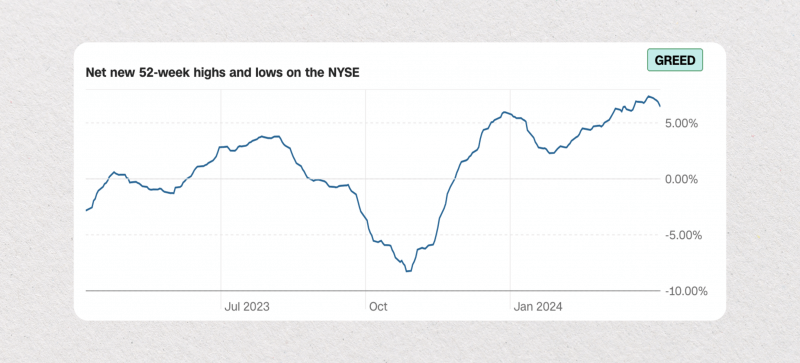
The second indicator uses the New York Stock Exchange as a benchmark, comparing its 2-week peaks with the respective 52-week lows. If the highs are more frequent, this signifies aggressive investment behavior, hinting toward a greedy mara sentiment.
Stock Price Breadth
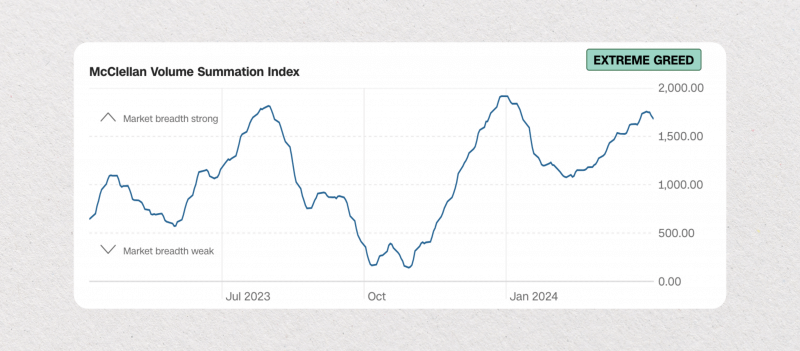
The third indicator in the F&G formula evaluates whether stocks are generally being bought more than sold. If the purchasing volumes exceed the selling volumes, the market is generally driven toward aggressive price action.
Asset Put and Call Options
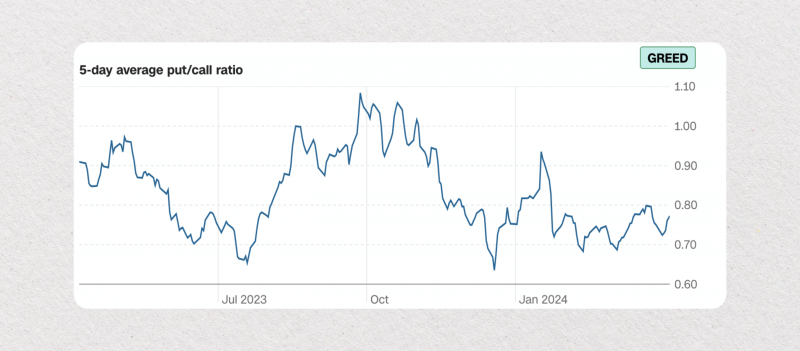
Put options are generally considered conservative mechanisms, allowing investors to minimize risks in the case of asset devaluation. Call options are the opposite, signaling an aggressive price action that drives asset values upward. If put options are more in demand than call options, the market will likely experience a downturn, and vice versa.
Junk Bond Demand
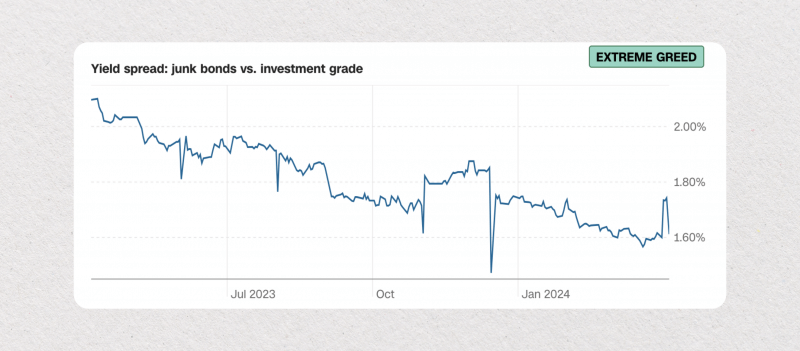
Junk bonds are regarded as lower-quality assets due to poor evaluation by rating agencies. Investment-grade bonds are the opposite, carrying elite evaluations and being considered a premier asset to acquire. If the junk bonds are not far behind the premier bonds, this signifies that market participants are less risk-averse and more aggressive, pointing toward a bullish market. If the junk bond demand is high, the F&G index will increase.
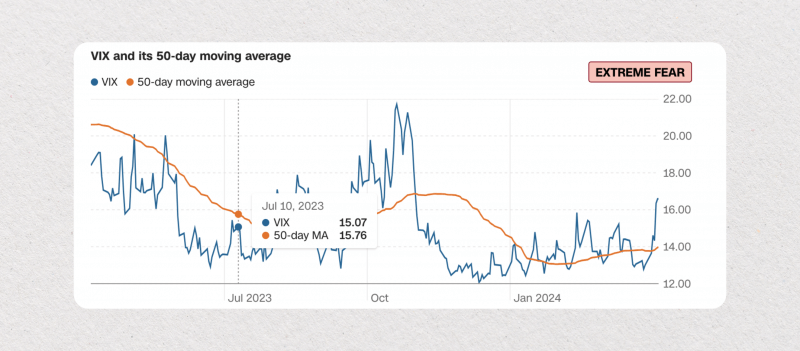
Market Volatility
The CBOE Volatility Index (VIX) is widely regarded as a reliable indicator of market volatility. When the VIX indicator goes up, the market becomes more conservative due to rising volatility. As a result, the F&G index generally decreases in such a climate.
Safe Haven Demand
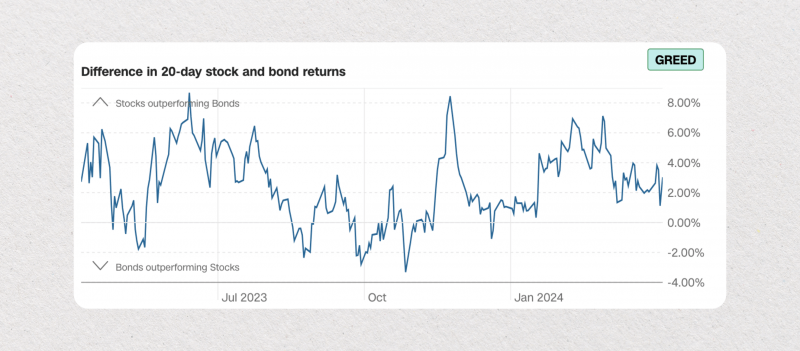
In general, government bonds and treasuries are considered to be much safer compared to stocks and other assets since the government backs them. So, the haven demand monitors the demand for treasuries against the demand for stocks.
If treasuries and bonds are more sought after in a specific period, we can conclude that the current market sentiment is shifting toward a more conservative outlook. As a result, the Fear and Greed Index goes down.
How Precise is the Fear & Greed Index?
The F&G index’s formula has many ingredients deriving from some of the most popular indicators in the trading landscape. Because of its complexity, many investors view the F&G index as too generic and imprecise.
Naturally, the F&G indicator is accurate with singular stocks or crypto fear and greed metrics, but what about general market sentiment? Even on a broader scale, the F&G index has showcased precision to a surprising degree during significant global events.
From the 2008 Housing Crisis to COVID-19
The retroactive calculation of F&G during the 2008 housing crisis showcased that the metric would be below 12 during the aftermath. Contrarily, the 2012 market expansion resulted in the F&G climbing up to 90 and showcasing an extreme greed metric throughout the trading landscape. Finally, COVID-19 caused one of the most significant investment recessions in modern history, presenting an extreme Fear and Greed Index low at only 2 out of 100.
These massive moments in the investment history showcase that F&G works on a global market and can correctly foresee the upcoming or ongoing troubles brewing underneath the investment activities. While it is not enough to analyze only the F&G indicator, understanding market momentum is a great starting point. The number of F&G’s ingredient formulas is too robust to produce a skewed result.
Naturally, the market Fear and Greed Index changes might have drastically different causes, but the ratio itself has never been skewed toward a false positive or negative. In other words, if the F&G index is moving, the market is constantly experiencing measurable changes.
How to Analyse and Use the Fear & Greed Index
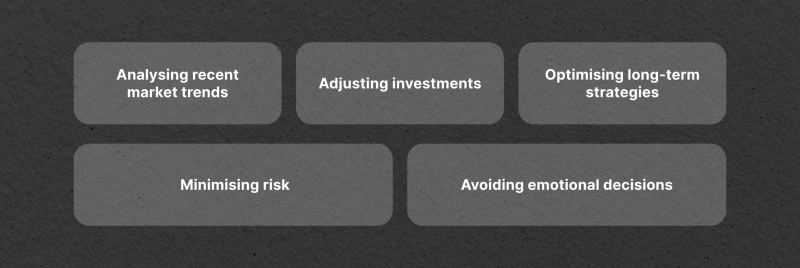
The stock Fear and Greed Index can be used in virtually every market assessment activity. Diligent traders should use the market greed index to weed out risky investments, re-arrange their strategies, and adjust their general approach according to market movements. Here’s how you can incorporate the F&G into your daily trading activities.
Catching Up with Recent Market Trends
Any asset market, including stocks, forex, crypto, and other commodities, moves incredibly fast. Traders deal with mountains of information that they have to consume every single day. While AI tools like ChatGPT have simplified this process, it still takes considerable time to analyze current events properly.
With the F&G index, it is much easier to get a hint at what you should be researching and analyzing. If the index goes up, research the market for hype and determine which stocks drive the greed momentum upward. From there, you can decide on more specific stocks or assets that are probably overhyped.
Conversely, if the stock market Fear and Greed Index goes down, you should analyze which stocks or other assets might be causing a conservative panic, leading to its devaluation. In most cases, the stocks that drive the F&G up or down might end up in your portfolio, and you should never make hasty decisions based on the general sentiment. This is where the F&G index shines, letting you understand the emotions of most investors with a single ratio.
Optimising Investment Strategies
The CNN greed and fear index wasn’t invented to be followed without any complementary analysis tools. However, it is a perfect starting point for investors to adjust their strategies. Generally, investors are mostly bullish, bearish, or a combination of the two at any given point. With the market fear index, it is much simpler to understand that your strategies might not be feasible in the current market.
For example, if F&G is up, continuing your aggressive investment strategies is probably not a good idea. Conversely, if F&G is down, you shouldn’t panic and reserve to sell your assets for damage control. So, F&G effectively tells you in a very concise manner what other investors are doing right now and, in most cases, gives you a sign that you should not follow the trends blindly.
Mitigating Market Volatility Risks
F&G can also be used as a safety zone for trading, letting you mitigate trading risks at all times. Many investors simply refuse to trade during the extreme fear or greed cycles, only entering the positions when the market is relatively neutral.
This way, you will have the reassurance that your purchased or sold stocks are properly valued. It goes without saying that the neutral F&G approach is not the most profitable, but it effectively minimizes the market risks at any given point.
The F&G Index in Crypto
The Fear and Greed Index for cryptocurrency is calculated similarly to the stock market. Investors often use the Fear and Greed Index crypto metric to gauge market hype and avoid entering a bubble during its critical stages.
Arguably, the fear and greed crypto index is even more essential, as the crypto industry is often prone to significant shifts in market sentiment. Due to its young age, the blockchain field experiences massive bull runs and bear markets, motivated by hype and panic, respectively. Without the necessary safeguards, the blockchain field can become a dangerous area for investment.
So, the Fear and Greed Index crypto metric ensures that you are always aware of the market momentum. As a result, you will be able to avoid excessive bull runs and stay calm during the panic-induced periods of crypto winters.
Final Thoughts – How Fear & Greed Uncovers Market Sentiment
The F&G index is a great indicator to jumpstart your market analysis. It delivers a concise overview of the trading market and points you in the right direction from the get-go. The Fear and Greed Index can be applied to practically any investment activity as it uncovers the most critical movement in the trading landscape – the market sentiment.
Whether you are a newcomer trader or an experienced pro, having a firm grasp on the F&G index is mandatory, allowing you to gauge the market momentum in seconds. So, before making any commitments or long-lasting decisions, it is prudent to check the F&G and see if your investment strategies align with the market’s current climate.
FAQs:
How accurate is the fear & greed index?
The F&G index has showcased pinpoint accuracy in predicting massive market shifts. It is practically impossible to have a bull run or a bear market without the F&G going up or down.
What differentiates fear & greed index crypto from the regular version?
The crypto variant of F&G is similarly calculated but serves an even more important purpose. Since crypto is highly volatile, it is crucial to regularly monitor the F&G index and analyze whether the market is driven by empty hype or extreme panic.
How can I benefit from the F&G index?
Whether you are an investor, a financial analyst, a broker, or just a trading enthusiast, the F&G index will give you a swift and concise summary of the current market sentiment.


