Bitcoin Power Law Explained: How It Shapes BTC’s Long-Term Growth
Apr 1, 2025

The extreme volatility of Bitcoin can be overwhelming, and even experienced traders sometimes struggle to separate noise from real trends. But what if there was a pattern beneath the chaos? The Bitcoin power law is a model that suggests there is structure to the main cryptocurrency’s long-term growth.
Instead of viewing the market as unpredictable, this approach shows how Bitcoin may follow a consistent and measurable path that can be mapped, analyzed, and even used to make smarter investment decisions.
Key Takeaways:
- The Bitcoin power law model shows that BTC price growth follows a consistent, exponential trend over time.
- Historical data shows consistent alignment with the power law curve, especially during major market cycles.
- As with any model, it has limitations and should be used alongside other analysis methods for better decision-making.
What Is a Power Law?
A power law describes a specific kind of relationship between two quantities. In this relationship, one quantity varies as a power of another. Mathematically, it looks like this:

Where:
- y is the output (dependent variable)
- x is the input (independent variable)
- a is a constant
- k is the exponent or power
What makes power laws different from more common patterns, like bell curves or averages, is that there’s no “typical” value. Most people or events fall on the smaller end, while a few outliers dominate the upper range.
Power laws also tend to look like straight lines when plotted on a logarithmic scale. This is one of the easiest ways to spot them in data. If you’ve ever seen a graph where Bitcoin’s price follows a straight upward curve on a log chart, that’s power-law behavior in action.
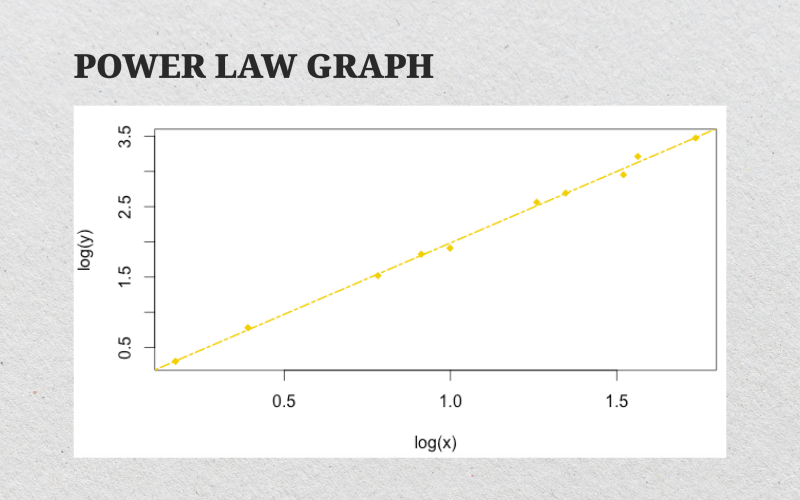
Power laws are ubiquitous in nature and in human societies. They appear, for example, in the wealth distribution, where a small number of individuals possess a disproportionate amount of resources, and in natural phenomena such as earthquake magnitudes or word frequencies in language.
Power laws in financial markets can help explain why large market moves are more common than a normal (Gaussian) distribution would predict. The heavy tails of a power-law distribution imply that extreme events – both positive and negative – occur with a higher probability. This insight is critical for risk management and forecasting in volatile markets like cryptocurrency.
What is the Bitcoin Power Law?
The Bitcoin power law is a theoretical model that applies the mathematical principle to Bitcoin’s price. It suggests that Bitcoin’s price growth over time follows a predictable exponential path when plotted on a logarithmic scale.
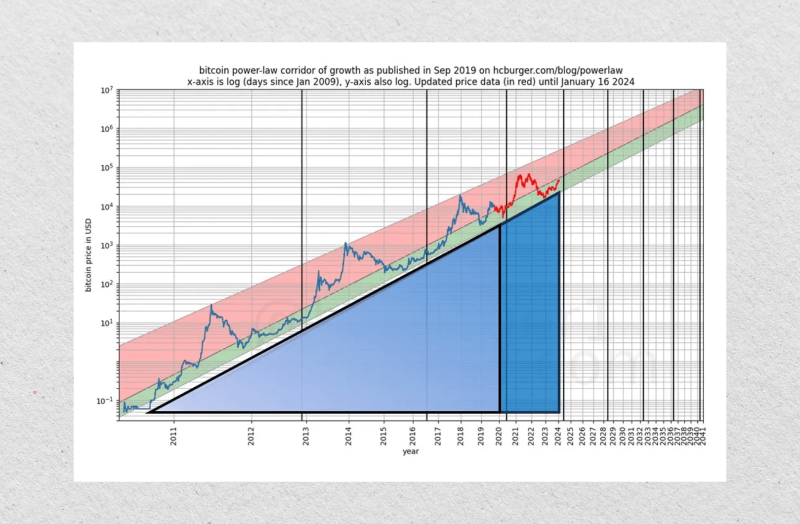
This idea gained traction through the work of Giovanni Santostasi, an analyst who mapped BTC’s historical price data and found that it aligns closely with a power law curve. Rather than seeing Bitcoin as a volatile rollercoaster, this model views it as an asset growing within a structured range.
According to Giovanni Santostasi, Bitcoin’s price increases are not random—they follow a scaling pattern where each bull market builds on top of the last but within certain boundaries.
On a logarithmic chart, this creates a channel:
- The bottom of the channel represents long-term support,
- The top acts as a ceiling during bull markets.
Bitcoin’s price has historically bounced between these two boundaries over time, following the path set by this power law structure. Many long-term investors use this kind of analysis to understand where Bitcoin might go in the future, not as a guarantee but as a framework for probability and trends.
Bitcoin Power Law Model vs Other Forecast Models
Understanding how Bitcoin’s price behaves over time is one of the biggest challenges in crypto investing. Over the years, several models have emerged to help investors make sense of the chaos. Among the most talked-about are the power law model, the Stock-to-Flow model, and logarithmic regression.
Each has its own strengths and weaknesses, and each offers a unique lens through which to view Bitcoin’s growth.
Stock-to-Flow (S2F)
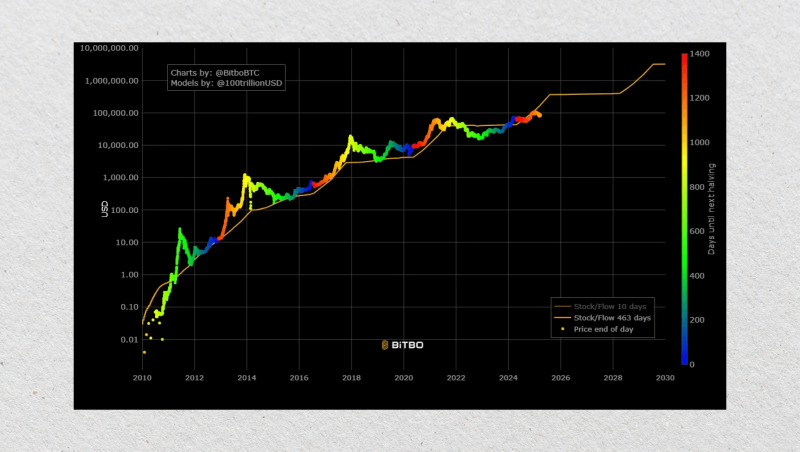
The Stock-to-Flow model became very popular around 2019 because of the pseudonymous analyst PlanB. It takes the principle that scarcity drives value. The model compares Bitcoin’s existing supply (stock) and the rate of new coins being mined (flow).
As per S2F, when Bitcoin’s issuance rate diminishes because of halving events, its price should increase correspondingly. The method gained tremendous popularity during the 2020–2021 bull run when BTC tracked S2F predictions quite closely.
But beyond 2021, Bitcoin’s price began to deviate from the model. Critics claimed it didn’t account for demand-side factors, or macroeconomic shocks. So, some now find it too simplistic to predict long-term.
Logarithmic Regression (Bitcoin Rainbow Chart)
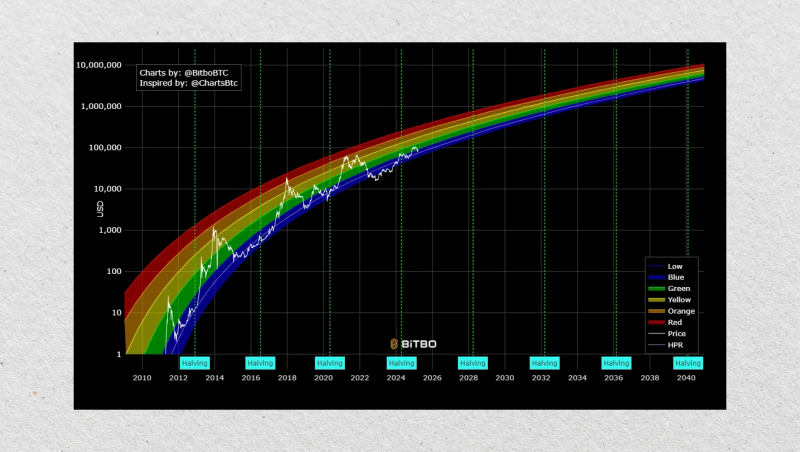
Logarithmic regression is another popular method to project Bitcoin’s long-term price trend. It fits historical BTC prices into a curved trendline on a logarithmic chart. The idea is that Bitcoin grows rapidly in its early years and slows down as the market matures.
Unlike S2F, this model doesn’t rely on supply dynamics. Instead, it looks at how prices have historically behaved and uses that pattern to create a “growth curve.”
It’s a relatively simple and visual model. Many tools and charts online use this method to display Bitcoin’s “fair value” over time. However, like all regression models, it assumes the past can be a predictor of the future, which isn’t always the case.
Power Law Model
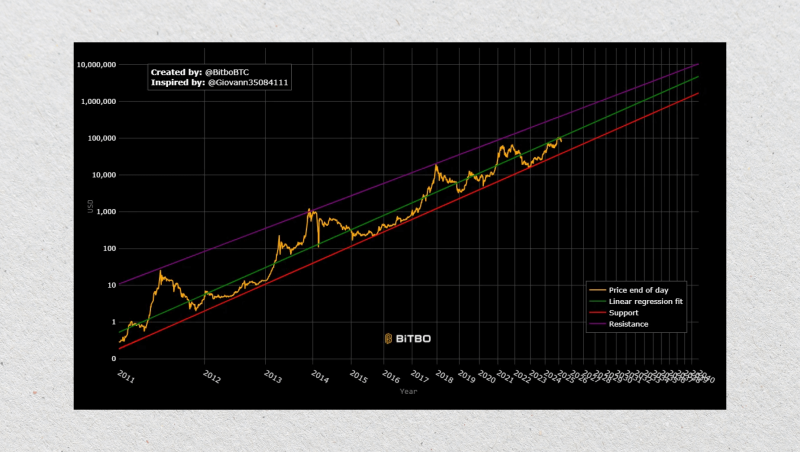
The Bitcoin power law model stands out for its balance of mathematical rigour and visual clarity. It shares some similarities with logarithmic regression — both models use log-scaled charts — but the power law is grounded in deeper mathematical theory related to how complex systems evolve over time.
What sets the power law apart is its focus on scale invariance. This means patterns in Bitcoin’s price repeat themselves regardless of the time frame. Whether you’re looking at a decade or a year, the general growth trend fits into the same kind of curve.
The model offers a clearer framework for understanding long-term price “bands” — areas where Bitcoin is likely overvalued or undervalued. It avoids overfitting and doesn’t rely on arbitrary cycles or halving dates.
Bitcoin Power Law Calculator
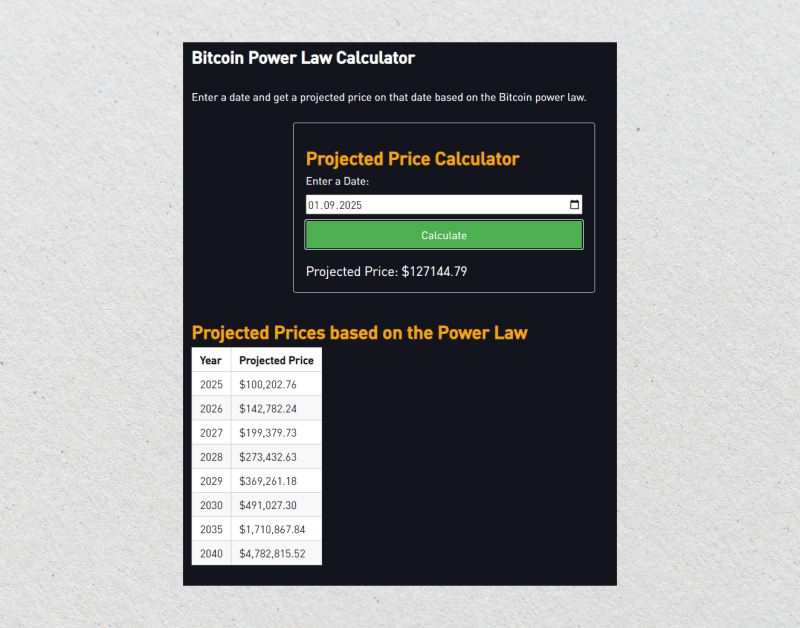
The Bitcoin power law calculator can make it simpler to see where Bitcoin currently stands in relation to its long-term trend and where it might be heading.
These calculators are typically built on the basis of historical price data and the underlying power law equation. They predict using mathematical constants derived from historical performance and allow users to estimate a “fair value” for Bitcoin at any point in time.
But, like all forecasting devices, these calculators don’t account for unforeseen market disruptions, regulatory actions, or volatile demand swings. They’re designed for macro-level analysis, not for daily trading decisions.
Benefits of the BTC Power Law Model for Investors
The power law model offers several advantages that can help investors navigate the ups and downs of the crypto market with greater clarity.
Long-Term Perspective
The Bitcoin power law model takes out short-term fluctuations and noise. Instead of seeing daily or weekly price movement, it brings the spotlight on to a multi-year trend due to consistent patterns throughout history. It helps investors in making sensible decisions away from emotions during surprise spurts or declines in the market. It encourages a focus on the bigger picture — which is especially valuable in a highly volatile market like crypto.
Simple and Visual
When plotted on a logarithmic chart, the power law curve creates an intuitive visual guide to Bitcoin’s price trend. This makes it easier to assess whether BTC is relatively overvalued or undervalued. No complex indicators or technical tools are required to grasp the model’s core insight.
Transparent and Accessible
Unlike many proprietary trading systems or complex financial models, the power law approach is open and easy to replicate. Anyone with access to historical Bitcoin data and basic spreadsheet skills can explore it. Many calculators and visualisations are available online for free, and most are open-source.
Strategic Decision-Making
While it shouldn’t replace full portfolio analysis, it’s a useful reference point for timing long-term positions. It also serves as a reality check, preventing investors from buying into the hype when prices shoot far above the trendline or panic-selling during corrections.
Limitations and Criticisms
No model is perfect, and the Bitcoin power law is no exception. While it has strong historical backing, it also comes with risks and limitations that every investor should understand.
Not Built for Short-Term Predictions
The model works best over long time frames—months or years. It doesn’t capture short-term market psychology, news-driven price moves, or sudden demand surges, which means it’s not helpful for active trading or short-term forecasting. Trying to apply a Bitcoin power law price prediction to day-to-day movements can lead to unrealistic expectations.
Based Solely on Past Performance
Like most models, the power law relies heavily on historical price data. It assumes the future will follow similar patterns, which isn’t guaranteed in a fast-evolving ecosystem like crypto. Any significant change in Bitcoin’s underlying fundamentals, such as regulation, technology shifts, or global adoption trends, could render the model less reliable.
Doesn’t Account for External Shocks
Macroeconomic crises, black swan events, or regulatory crackdowns can send Bitcoin prices far off the expected curve. The model cannot anticipate these factors. When such events occur, the price may stay out of the projected range for extended periods, challenging the assumption of mean reversion.
Curve-Fitting Risk
There’s always a risk that the model is simply a best-fit curve that looks good in hindsight. It’s possible that the model works until it doesn’t, particularly if major structural changes affect Bitcoin’s growth trajectory. This is a common criticism of any backward-looking statistical model. Correlation with historical price doesn’t necessarily mean causation.
Historical Analysis: Does It Hold Up?
The strength of any price model lies in how well it reflects reality, especially over time. In Bitcoin’s case, the power law model has shown a surprisingly strong fit when mapped against its long-term price history.
Looking back at Bitcoin’s earliest years, even with limited market data and extreme volatility, the price already began to align with the general curve described by the power law. While short-term movements were chaotic, the macro trend was clearly upward and followed a consistent slope on a logarithmic scale.
During the 2013 bull run, Bitcoin shot up from double digits to over $1,000, only to crash in 2014. Despite the correction, the long-term curve remained intact. The price didn’t fall out of the power law’s lower band — it simply reverted to the mean.
This pattern repeated itself in 2017. Bitcoin reached nearly $20,000, overshooting the upper band of the curve. But again, the following bear market in 2018 brought it back within the boundaries predicted by the model.
Even the dramatic 2021 rally, followed by a harsh 2022 correction, still adhered to the model’s logic. Though Bitcoin dipped below the expected range at times, the overall trend didn’t break.
Final Remarks
The Bitcoin power law model provides a compelling lens through which to understand BTC’s long-term price behavior. Translating chaotic price action into a smooth, exponential trend gives investors a valuable reference point. While not perfect, it offers clarity in an often uncertain market and helps distinguish between noise and signal.
FAQs:
Does Bitcoin follow a power law?
Historical records show that the price of Bitcoin will follow a power law pattern when plotted on a logarithmic scale. While short-term fluctuations are unstable, long-term trends follow a predictable exponential curve.
What is the Bitcoin power law formula?
The formula is typically written as P(t) = a × t^k, where P(t) represents the price at time t, a is a scaling constant, and k is the growth exponent.
Can I use the Bitcoin power law for short-term trading?
The Bitcoin power law model is designed to be used for long-term and not for day-to-day or short-term price change predictions.


