How to Trade Crypto Using Wyckoff Accumulation Theory
Aug 27, 2024

In today’s reality, to be successful, you must have in-depth knowledge of the business you serve. Especially if your field of activity is related to finance, you must have mastered strategies and methods that have already been tested. The booming cryptocurrency world can be thrilling yet daunting for traders because it requires a deep understanding of market dynamics and effective strategies.
One such strategy is the Wyckoff accumulation theory. This method helps traders identify key phases in the market, offering insights into optimal entry and exit points. By mastering Wyckoff accumulation, traders can make more informed decisions and potentially increase profitability.
Key Takeaways:
- Wyckoff Accumulation Theory helps traders identify when large institutions accumulate crypto assets at bargain prices, signaling a potential price increase.
- By understanding the different phases of the Wyckoff market cycle, traders can position themselves for entries and exits aligned with institutional activity.
- When combined with other technical indicators and sound risk management strategies, Wyckoff analysis can enhance a trader’s ability to navigate the crypto market.
Understanding Wyckoff Accumulation Theory

Wyckoff Accumulation Theory is part of the broader Wyckoff Method, a set of principles and techniques developed by Richard D. Wyckoff in the early 20th century. This theory is used in technical analysis to understand market trends and price movements, mainly focusing on the accumulation phase, where informed investors and institutions, often called “smart money,” are believed to be quietly buying a stock before the price significantly increases.
The Wyckoff method comprises several key phases:
- Accumulation: Institutions buy assets at low prices.
- Markup: Prices rise as the market responds to increased demand.
- Distribution: Institutions sell off their holdings at high prices.
- Markdown: Prices decline as the market corrects.
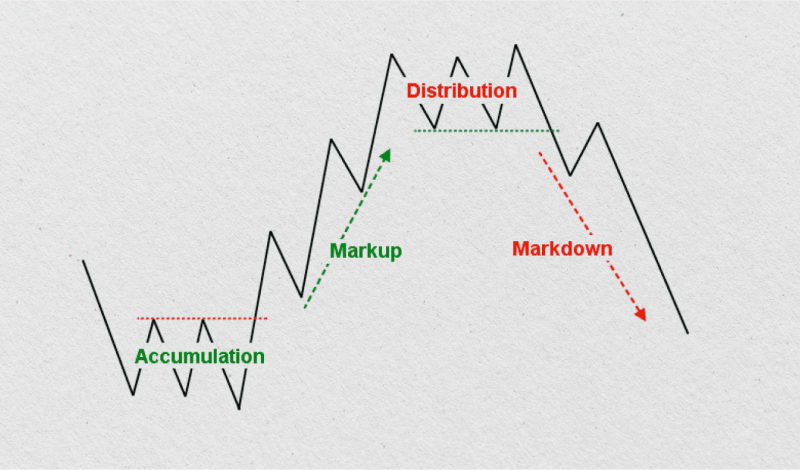
Traders use Wyckoff market cycle Theory to identify potential buy points and forecast future price movements. By determining the accumulation phases, they aim to enter positions before a significant uptrend begins.
Fast Fact:
The Smart Money Concept (SMC) is a trading strategy focused on understanding and leveraging the market movements initiated by institutional investors, such as banks and hedge funds.
Phases of Wyckoff Accumulation
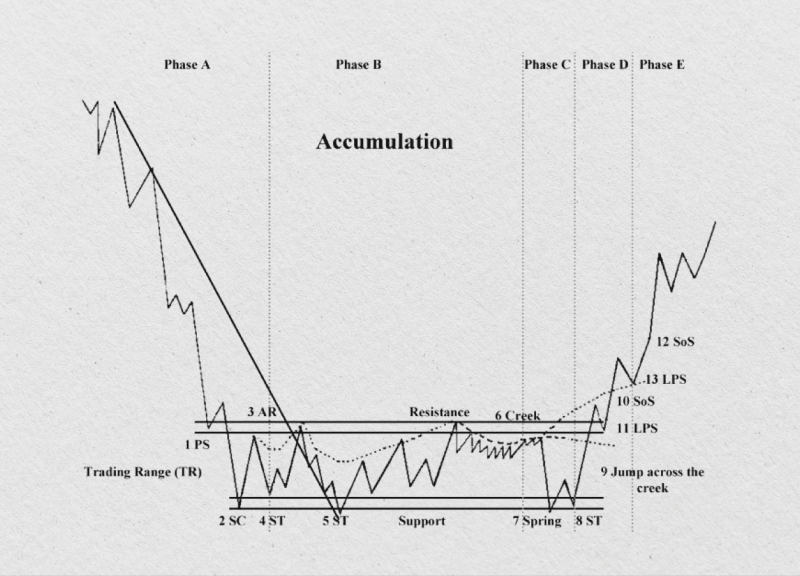
The Wyckoff Accumulation Schematic outlines the various stages institutions go through during accumulation. Here’s a breakdown of these key phases that signal different market behaviors:
Phase A: Stopping the Downtrend
This phase marks the end of a downtrend and the beginning of potential accumulation. Price finds initial buying interest at specific support levels, indicated by increased buying volume.
- Preliminary Support (PS): Initial signs that the downtrend is weakening as significant buying begins to provide support. Volume increases, and the spread widens.
- Selling Climax (SC): This is where selling pressure is at its maximum. Prices drop sharply, often with heavy volume, followed by automatic buying as the market becomes oversold.
- Automatic Rally (AR): Following the SC, the price rebounds automatically due to the exhaustion of selling pressure. The AR sets the upper boundary of the trading range.
- Secondary Test (ST): The price revisits the area of the SC to test the supply and demand balance. This may occur more than once, with volume and price spread typically diminishing.
The Wyckoff schematic for this phase shows the initial halt in the downtrend and the formation of a trading range.
Phase B: Building a Cause
This phase involves forming a trading range where the stock price moves sideways. The purpose is to build a cause for the subsequent uptrend. The range is defined by the resistance (upper boundary) and support (lower boundary) levels established in Phase A.
During this phase, the asset trades within a range as institutions accumulate their positions. Higher lows and higher highs indicate increased demand.
The Wyckoff accumulation pattern develops, signaling the potential for a future breakout.
Phase C: Testing Supply
This critical phase involves testing the market’s supply. A spring or shakeout may occur, where the price drops below the trading range, tricking weak hands into selling.
- Spring: A false breakout occurs to the downside, often called a “spring” or “shakeout.” This move is designed to test the support level, trigger stop-loss orders, and shake out weak hands. It provides a final opportunity for strong hands to buy before the uptrend.
- Test of the Spring: After the spring, the price usually tests the same support level again with lower volume, confirming that supply has been absorbed.
A deeper test of support (UST) occurs to gauge the strength of buying interest. Upthrusts (UTs) – sudden price increases with high volume – may also appear, indicating institutions accumulating at these lower levels.
Phase D: Confirmation – Sign of Strength (SOS)
A decisive break above the resistance level of the trading range marks a potential “Sign of Strength” (SOS). This signifies institutions have accumulated enough, and the price is poised for a potential markup phase.
The price begins to move higher, breaking out of the trading range established in Phase B. Now, demand exceeds supply, resulting in higher highs and higher lows. This phase often sees increased volume and widening price spreads as the stock attracts more attention.
Phase E: Markup
In this final phase, the uptrend continues as the stock price moves significantly higher. The stock market is now strong, and there is little selling pressure. The price may experience pullbacks, but the overall trend remains upward. This phase offers significant trading opportunities.
By identifying these phases, retail traders can better anticipate when a stock market is likely to transition from a period of accumulation to a markup, potentially providing lucrative buying opportunities.
Besides accumulation, Wyckoff’s theory also addresses distribution and reaccumulation phases, which are essential for a comprehensive trading strategy.
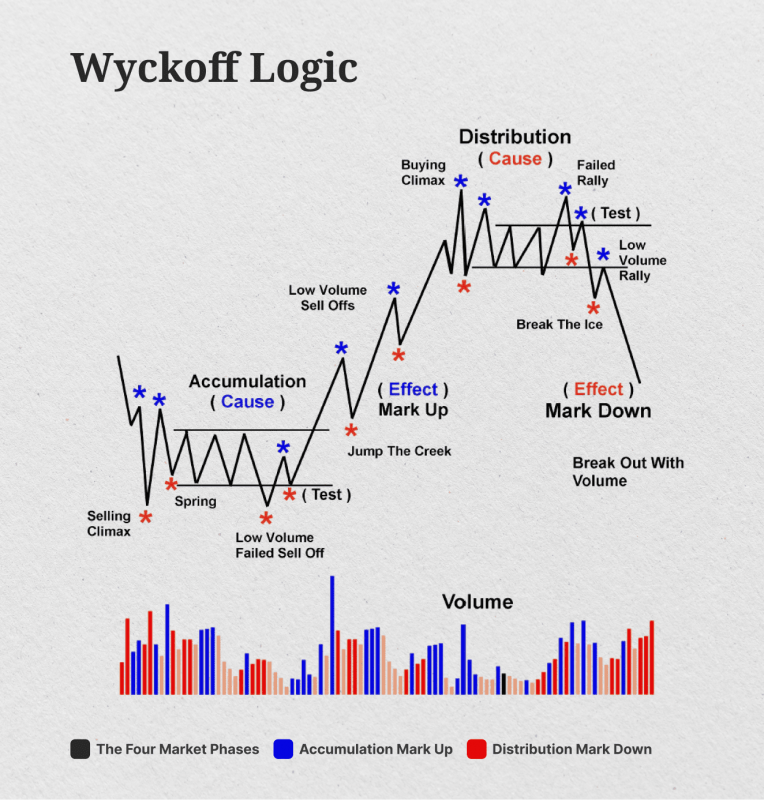
Wyckoff Distribution
The Wyckoff distribution phase occurs when smart money sells off its positions at high prices. This phase precedes a markdown. Key indicators of this phase include preliminary supply (PSY), buying climax (BC), automatic reaction (AR), and secondary test (ST).
The Wyckoff distribution pattern and schematic help retail traders recognize these stages and anticipate market downturns.
Wyckoff Reaccumulation
Wyckoff reaccumulation happens after an initial markup, where the asset consolidates before continuing its upward trend. This phase provides additional buying opportunities.
Tools and Indicators for Wyckoff Analysis
Analyzing the Wyckoff method involves using various tools and indicators to identify the phases of accumulation and distribution and other market behaviors. Here are some essential tools and indicators commonly used in Wyckoff analysis:
Price Charts
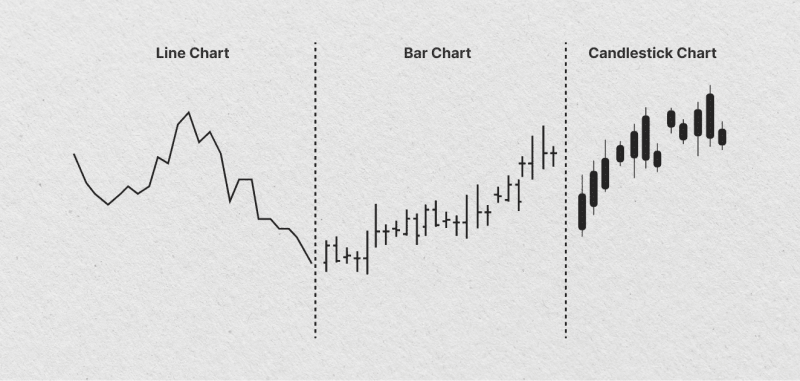
Bar and Candlestick Charts analyze price movements and identify patterns associated with different phases of accumulation and distribution. At the same time, Point and Figure Charts help determine price objectives and measure the extent of price movements.
Volume Analysis
Observing the volume bars in conjunction with price movements helps to confirm the presence of accumulation or distribution. Volume Spread Analysis (VSA) focuses on the relationship between price spread (range) and volume to identify buying or selling pressure.
Moving Averages
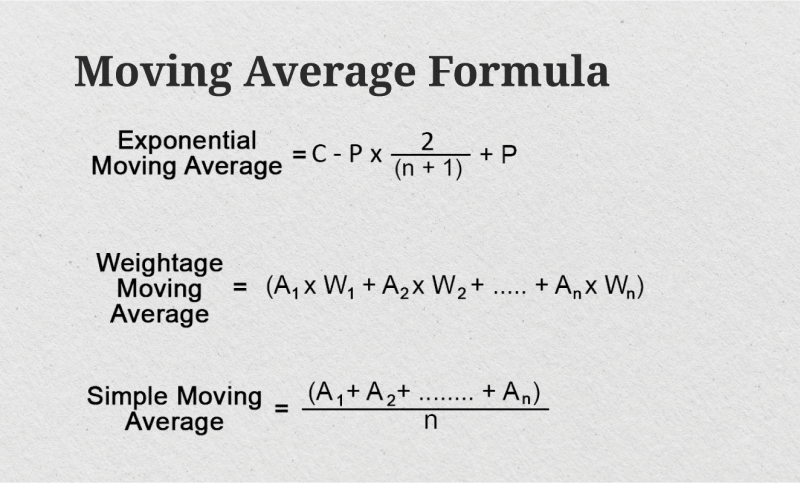
Simple Moving Averages (SMA) smooth price trends and help identify their direction, while Exponential Moving Averages (EMA) give more weight to recent prices and are more responsive to new information.
Relative Strength Index (RSI)
RSI measures the speed and change of price movements to identify overbought or oversold conditions, which can help identify potential turning points within Wyckoff phases.
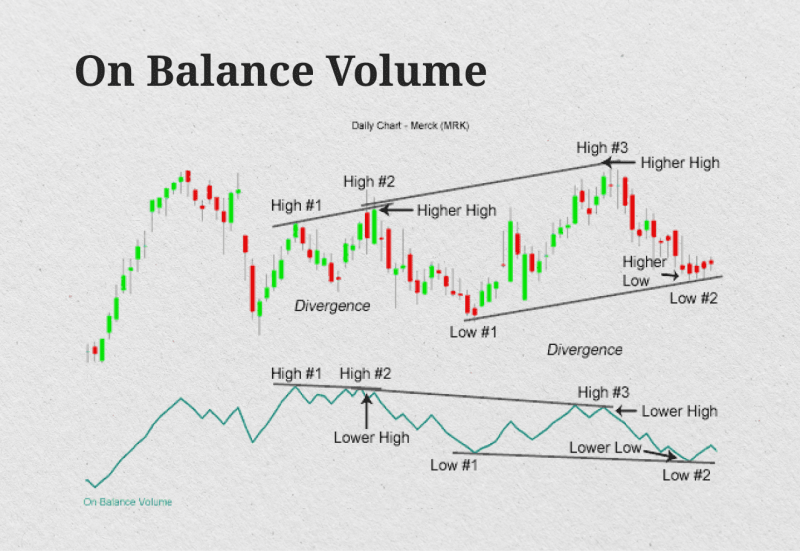
On-Balance Volume (OBV)
OBV tracks the cumulative buying and selling pressure by adding volume on up days and subtracting volume on down days. It helps in confirming price movements.
Accumulation/Distribution Line (A/D Line)
A/D Line attempts to gauge the cumulative flow of money into and out of a security, identifying whether a stock is being accumulated or distributed.
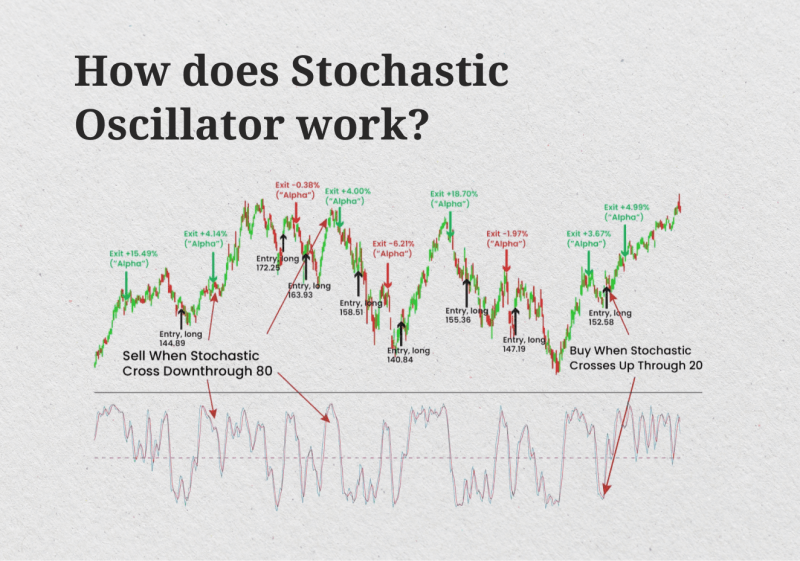
Stochastic Oscillator
A Stochastic Oscillator compares a particular closing price to a range of prices over a certain period, helping identify potential overbought or oversold conditions.
Trend Lines and Channels
Trend Lines drawn across significant price points help identify the direction of the trend. In contrast, Channels, parallel trend lines that encompass most price action, are used to identify potential breakout points.
Support and Resistance Levels
Support Levels—price levels where buying interest is strong enough to overcome selling pressure—are identified during the accumulation phases. Resistance Levels, where selling interest overcomes buying pressure, are specified during the distribution phases.
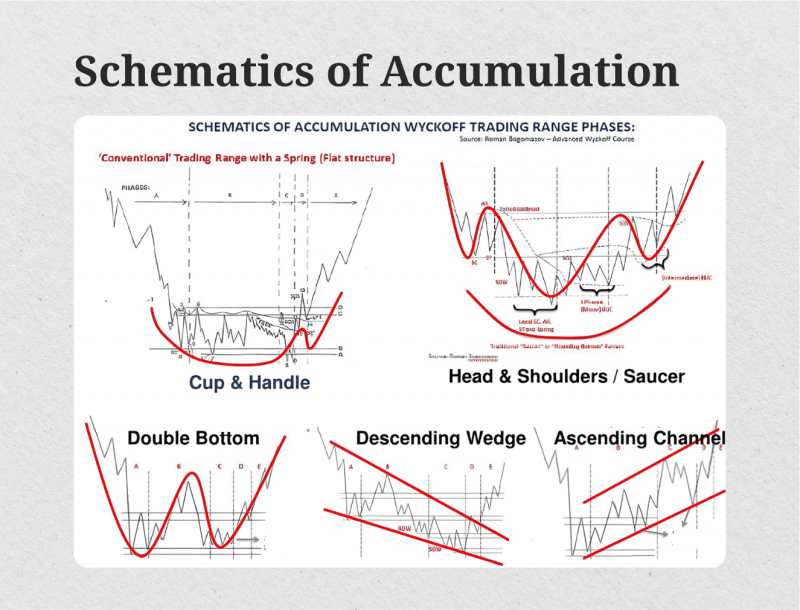
Wyckoff Schematics
Wyckoff Schematics is a visual representation of the accumulation and distribution phases, including key events and phases such as PS, SC, AR, ST, spring, and breakout.
Volume Profile
Volume Profile is a horizontal histogram that shows the volume traded at each price level over a specific time. It helps to identify high-volume nodes, which can act as support or resistance levels.
Relative Strength (RS)
Relative Strength compares one stock’s performance against another or an index. It helps to identify strong performers during the accumulation phases.
Successful Wyckoff analysis often combines multiple tools and indicators to understand the market structure comprehensively. For instance, volume analysis combined with price action and support/resistance levels can provide stronger signals for identifying the accumulation and distribution phases.
Applying Wyckoff Accumulation Theory to Crypto Trading
Applying Wyckoff’s Accumulation Theory to crypto trading involves adapting its principles to the unique characteristics of cryptocurrency markets, which can be highly volatile and driven by different dynamics than traditional markets. Here’s how you can apply Wyckoff Accumulation Theory to crypto trading:
Identify the Market Phase
Use the Wyckoff phases to determine if the market is in accumulation, markup, distribution, or markdown. Analyze the Wyckoff schematic to understand current market conditions.
Analyse Volume and Price Action
Volume is a crucial indicator in the Wyckoff method. High volume during accumulation suggests strong buying interest. Study the Wyckoff chart to identify patterns and potential breakout points.
Spot the Key Levels
Identify preliminary support (PS), selling climax (SC), automatic rally (AR), and secondary test (ST) during the accumulation phase. Use the Wyckoff accumulation schematic to visualize these levels.
Wait for Confirmation
Avoid entering trades prematurely. Wait for confirmation of a breakout from the trading range. The accumulation manipulation distribution pattern can help distinguish false breakouts from genuine ones.
Cryptocurrency-Specific Indicators
While traditional indicators like RSI and moving averages are useful, consider using indicators specific to cryptocurrencies, such as token-specific metrics, blockchain analytics, and social sentiment indicators.
Execute the Trade
Enter the trade once the breakout is confirmed, preferably during Phase D of the accumulation. Set stop-loss orders to manage risk effectively.
Monitor the Market
Continuously monitor the market for signs of distribution or reaccumulation. Cryptocurrency markets are often influenced by news and sentiment. Positive news or developments can trigger accumulation phases as investors and traders anticipate future price increases.
Conversely, negative news can lead to distribution phases where investors sell off their holdings. Adjust your strategy based on the Wyckoff trading method and evolving market conditions.
Common Mistakes and Tips
While the Wyckoff method is powerful, traders often make mistakes that can lead to losses. Here are some tips to avoid common pitfalls:
- For confirmation, combine Wyckoff’s analysis with other technical indicators, such as the Relative Strength Index (RSI) or the Moving Average Convergence Divergence (MACD).
- Focus on high-volume cryptocurrencies with established track records, as Wyckoff patterns are easier to identify in liquid markets.
- Practice patience and discipline. Wait to confirm a breakout above resistance before entering a trade.
- To limit potential losses, consistently implement robust risk management strategies, including stop-loss orders.
Keep in mind that markets evolve, and so should your strategy.
Historical Examples of Wyckoff Accumulation in Cryptocurrency Markets
Wyckoff Accumulation patterns in cryptocurrency markets can be observed in various instances, reflecting the principles of accumulation phases followed by subsequent price increases. Here are a few historical examples:
Bitcoin (BTC) 2015-2016 Accumulation
After the significant price decline following the 2013 peak, Bitcoin entered a multi-month accumulation phase characterized by sideways price action and decreasing volatility. This period was marked by several attempts to break lower (spring), followed by recoveries back into the accumulation range. Eventually, Bitcoin broke out above the accumulation range in early 2017, initiating a new bull run that led to the historic highs of late 2017.
Ethereum (ETH) 2018-2020 Accumulation
Following the sharp decline in 2018 from its peak, Ethereum entered a prolonged accumulation phase throughout 2019 and early 2020. The price stabilized relatively narrowly, showing signs of accumulation as volumes decreased and volatility contracted. This period preceded Ethereum’s breakout in mid-2020, starting a new uptrend that continued into 2021.
Conclusion
The Wyckoff accumulation theory offers a systematic approach to understanding market cycles and making informed trading decisions. By mastering the Wyckoff method, traders can identify profitable opportunities and mitigate risks. Whether you are a novice or an experienced trader, incorporating Wyckoff principles into your strategy can enhance your trading performance.
Remember, the Wyckoff Method is a powerful tool, but it’s just one piece of the puzzle. Conduct thorough research, combine Wyckoff analysis with other indicators, and prioritize sound risk management.
