Price-to-Earnings (P/E) Ratio Guide: Definition, Formula, and Examples
Aug 07, 2024

The year 2024 has ushered in a wave of change, growth, and uncertainty for the stock market. The bull market charged through the first half with record-breaking highs, greatly exceeding the expectations of investors and experts. However, as we enter the second half of the year, questions arise about how long this trend will last.
In a market fraught with risks, especially amid a mixed economic outlook and uncertain Federal Reserve policies, market participants stick to tried-and-true metrics to evaluate their potential investments. One of the most talked about measurements is the Price-to-Earnings (P/E) ratio. This deceptively simple ratio has been a mainstay in investment analysis for decades, providing insights into a company’s growth potential, market sentiment, and overall financial health.
In this guide, we’ll explore the intricacies of the P/E ratio, including its origins, calculation methods, and practical applications.
Key Takeaways
- The price-to-earnings ratio allows investors to assess a company’s relative value based on its profitability.
- The P/E ratio comes in three primary variants – Trailing, Forward, and Shiller.
- While a high ratio indicates expected higher earnings growth (growth stocks), a low ratio may suggest undervaluation (value stocks).
- The metric should not be used in isolation; it should be compared to the company’s fundamental analysis and the industry’s average.
The Fundamentals of P/E Ratio
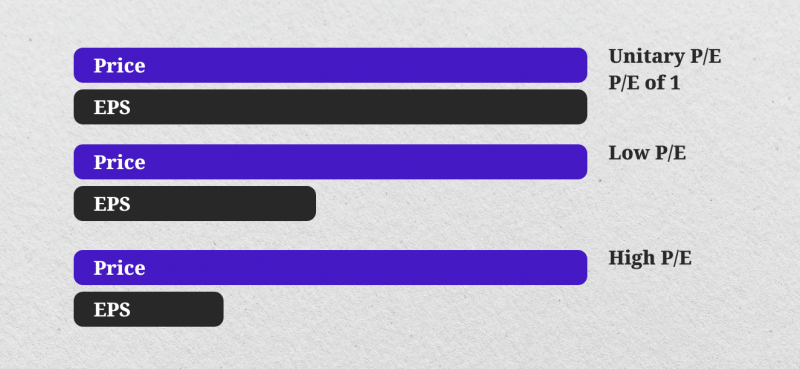
At its core, the price-to-earnings (P/E) ratio is a simple metric that compares a company’s stock price to its earnings per share (EPS). It provides a snapshot of how the market values a company’s profitability, offering investors a means to assess whether a stock is overvalued or undervalued.
So, how to calculate P/E ratio? The formula is as follows:

By dividing the current market price of a stock by the company’s earnings per share, the P/E ratio reveals how much investors are willing to pay for each unit of a company’s earnings. Having access to this information can be crucial if you want to determine a stock’s relative value since it allows for easy comparisons between different companies or industries.
A Bit of History
While the P/E ratio is a commonly used metric today, its roots can be traced back to the early 20th century. The concept gained widespread recognition in the 1930s when investment legends Benjamin Graham and David Dodd introduced it in their groundbreaking book, “Security Analysis.”
Over the decades, the price-earning ratio has solidified its position as a staple in financial analysis, evolving alongside the changing market dynamics and the rise of new valuation methods. From the 1950s and 1960s, when it gained popularity among investors, to the 1980s and 1990s, when it became a cornerstone of financial reporting, the P/E ratio has proven its enduring relevance in the investment landscape.
Today, as the market landscape continues to shift, with the increasing prominence of intangible assets and the emergence of alternative valuation techniques for tech startups, the P/E ratio remains a crucial metric, albeit with some adaptations and limitations.
Types of P/E Ratios
In terms of how to calculate the PE ratio, there are three primary approaches, each offering unique insights into a company’s valuation:
Trailing P/E
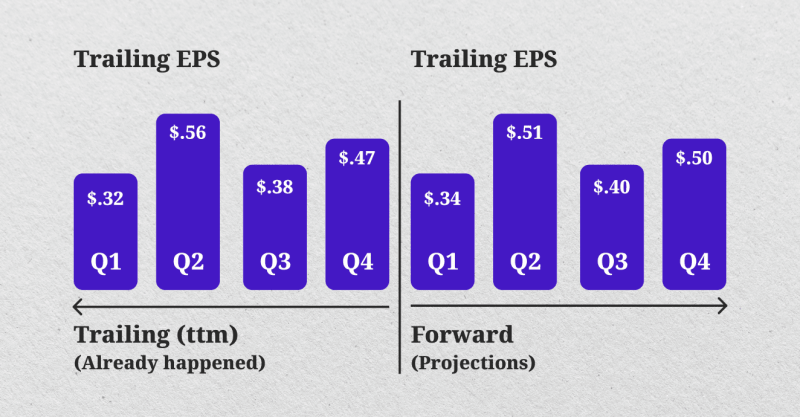
The trailing P/E ratio, also known as the historical or retrospective P/E, is the most commonly used variant. It is calculated by dividing the current stock price by the company’s EPS over the past 12 months. This approach relies on actual, reported financial data, providing a snapshot of the company’s past performance.
Forward P/E
In contrast, the forward P/E ratio uses projected or estimated future earnings to calculate the ratio. This forward-looking metric aims to provide insights into the market’s expectations for a company’s future growth and profitability. While it may be more speculative, the forward P/E can offer a glimpse into the company’s potential valuation.

Shiller P/E (CAPE)
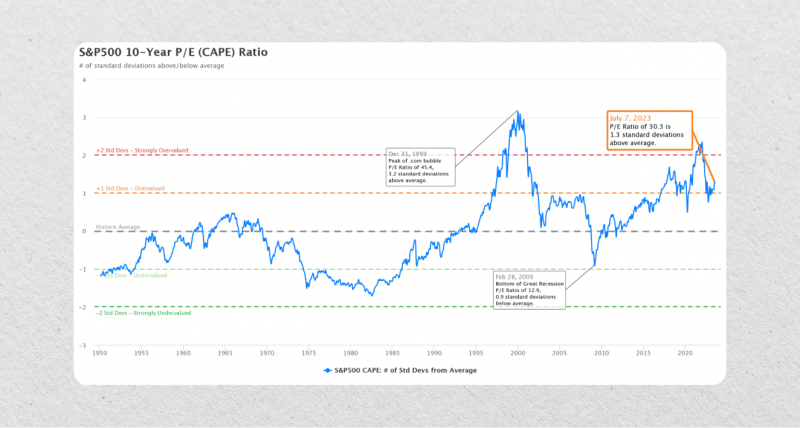
The Shiller P/E, also known as the Cyclically Adjusted Price-to-Earnings (CAPE) ratio, is a unique approach that factors in the average earnings over the past ten years, adjusted for inflation. This longer-term perspective can help smooth out short-term fluctuations and provide a more comprehensive view of a company’s or index’s valuation.
Each of these P/E ratio variants offers different advantages and drawbacks, catering to the diverse needs and preferences of investors.
Interpreting the P/E Ratio: High, Low, and Average
The interpretation of the P/E ratio is where the real insights begin to unfold. A high price/earnings ratio generally indicates that a company’s stock is considered a “growth stock,” with investors expecting higher earnings growth in the future. Conversely, a low price-to-earnings ratio may suggest that the stock is undervalued or considered a “value stock.”
In either case, these two types of stocks represent very different investment opportunities:
High Ratio: Growth Stocks
Growth stocks are companies expected to have above-average growth rates compared to the overall market. An innovative product, a growing market, or a competitive advantage may be responsible for this. Whatever the reason, investors typically flock to these companies with high expectations for future earnings growth and are willing to pay a premium for their shares.
However, investing in growth stocks is not without risk. As the expectation of high future earnings growth is already priced into the stock’s value, any deviation from these expectations can significantly drop the stock’s price. This volatility may make growth stocks less suitable for risk-averse investors.
Low Ratio: Value Stocks
On the other hand, value stocks are companies that are trading at a lower price compared to their fundamentals, such as earnings or book value. These undervalued stocks present an opportunity for investors to purchase them at a discounted price and potentially see a profit when the market corrects itself.
Value stocks are often found in mature industries with slower growth rates but steady dividends. They may not have the same potential for rapid growth as growth stocks, but they offer a more stable investment option for risk-averse investors.

It’s important to note that what constitutes a “high” or “low” P/E ratio can vary significantly across industries and market conditions. For example, the average P/E multiple for the S&P 500 index has historically hovered around 15-25, but certain sectors, such as technology, often have much higher average P/E ratios due to their growth potential.
To make meaningful comparisons, take into account a company’s P/E ratio in the context of its industry peers, its historical performance, and the overall market conditions. This relative analysis reveals whether a stock is overvalued, undervalued, or fairly priced compared to its competitors and the broader market.

Example of P/E Ratio
Suppose that Company XYZ and Company ABC are two competing companies in the same industry. Company XYZ has a stock price of $50 per share, while Company ABC’s stock is priced at $100 per share.
At first glance, it may seem that investing in Company XYZ would be the more expensive option. However, by comparing their P/E ratios, we can determine which company is actually cheaper from a valuation perspective.
Assuming that the industry average P/E ratio is 20, Company XYZ has a P/E ratio of 25 (calculated by dividing its stock price of $50 by its earnings per share of $2). In contrast, Company ABC has a P/E ratio of 10 (calculated by dividing its stock price of $100 by its earnings per share of $10), which means that investors pay more for each dollar of current earnings from Company XYZ, making it less attractive than Company ABC.
However, let’s also consider both companies’ growth potential and performance history. We may see that despite having a higher P/E ratio, Company XYZ may have a track record of consistent earnings growth, making it a more favorable investment option for those seeking long-term returns. In this case, Company ABC is considered a value stock, while Company XYZ is seen as a growth stock.
In this example, the PE multiple helps us see beyond just the stocks’ current prices and understand the market’s perception of their future potential. However, in real market scenarios, the P/E ratio is just one factor to consider.
The P/E Ratio and Future Stock Returns
The relationship between the P/E ratio and future stock returns has been extensively debated and researched. While the P/E ratio is widely used as a valuation metric, its ability to predict future stock performance is not always straightforward.
Moreover, the P/E ratio is not a reliable indicator of short-term price movements. It’s more useful in assessing the long-term valuation and growth prospects of a company or the broader market. Investors should exercise caution when relying solely on the P/E ratio to make investment decisions, as it is just one of many factors that can influence a stock’s performance.
Limitations and Considerations of the P/E Ratio
While the P/E ratio is a widely used and valuable tool, it’s important to recognize its limitations and consider additional factors when evaluating a company’s valuation.
One of the primary limitations of the price-to-earnings ratio is that it doesn’t account for a company’s debt levels, cash flow, or the quality of its earnings. A company with a high level of debt or one-time accounting adjustments may have a distorted price-earning ratio, which may not accurately reflect its true financial health.
Additionally, the P/E ratio can be challenging to interpret for companies with negative earnings or those in cyclical industries, where earnings can fluctuate significantly. In such cases, the metric may not provide a meaningful comparison or valuation assessment.
Furthermore, the ratio is most useful when comparing companies within the same industry, as different sectors can have vastly different average P/E ratios due to their unique characteristics and growth prospects. Comparing a technology company to a utility company, for instance, may not yield meaningful insights.
To overcome these limitations, investors often combine the P/E ratio with other financial metrics, such as the price-to-book (P/B) ratio, the price-to-sales (P/S) ratio, and the enterprise value-to-EBITDA (EV/EBITDA) ratio, to gain a more comprehensive understanding of a company’s valuation and financial health.
The P/E Ratio and Earnings Yield: Complementary Metrics
The P/E ratio is closely related to another important metric: the earnings yield. While P/E compares a stock’s price to its earnings, the earnings yield does the opposite, expressing a company’s earnings as a percentage of its stock price.
The earnings yield can be calculated as the inverse of the P/E ratio:

Earnings yield is often compared to current bond yields, as it provides a way to assess a stock’s relative attractiveness compared to fixed-income investments. This relationship is known as the bond-equity earnings yield ratio (BEER), and some studies suggest that it can be a reliable indicator of short-term stock price movements.
By examining both the P/E ratio and the earnings yield, investors can achieve a more nuanced understanding of a company’s valuation and potential returns. This dual analysis is particularly valuable for making well-informed investment decisions and assessing overall market conditions.
The PEG Ratio: Incorporating Growth Expectations
Another related metric that builds upon the P/E ratio is the price-to-earnings-to-growth (PEG) ratio. The PEG ratio takes the P/E ratio a step further by incorporating a company’s expected earnings growth rate into the equation.
The formula for the PEG ratio is as follows:

The PEG ratio aims to provide a more holistic assessment of a company’s valuation by considering both its current earnings and its future growth prospects. A PEG ratio of less than one is often considered an indicator that a stock is undervalued, as it suggests the company’s growth potential is not fully reflected in its current stock price.
While the PEG ratio can be useful, it’s important to note that it relies on projected earnings growth, which may not always materialize as expected. As with the P/E ratio, the PEG ratio should be used in conjunction with other financial metrics and a comprehensive analysis of the company’s fundamentals to make informed investment decisions.
Alternatives to the P/E Ratio
While the P/E ratio remains a widely used and influential metric, alternative valuation methods can provide additional insights into a company’s worth. Some of these alternatives include:

Price-to-Book (P/B) Ratio
The price-to-book (P/B) ratio compares a company’s stock price to its book value per share, representing its net assets. This ratio is particularly useful for evaluating companies with substantial tangible assets, such as those in the manufacturing or real estate industries.
Price-to-Sales (P/S) Ratio
The price-to-sales (P/S) ratio compares a company’s stock price to its revenue per share. This metric can be valuable for analyzing companies that may not be profitable yet, such as high-growth startups or companies in volatile industries, where earnings may fluctuate.
Enterprise Value-to-EBITDA (EV/EBITDA) Ratio
The enterprise value-to-EBITDA (EV/EBITDA) ratio assesses a company’s valuation relative to its earnings before interest, taxes, depreciation, and amortization (EBITDA). This measure provides a more comprehensive view of a company’s valuation, as it takes into account the company’s debt and cash levels.
While the P/E ratio remains a central metric in financial analysis, these alternative valuation methods can offer complementary insights and a more holistic understanding of a company’s worth, particularly in specific industries or situations where the P/E ratio may have limitations.
Conclusion: What Is the P/E Ratio for Investors?
The price-to-earnings ratio is an indispensable tool in finance, offering investors a robust method to evaluate a company’s stock valuation. By grasping the nuances of different P/E ratios, their interpretation, and inherent limitations, investors can utilize this metric to make more informed and strategic investment choices.
Whether you are a seasoned investor or embarking on your financial journey, mastering the P/E ratio can significantly enhance your investment success.
However, keep in mind that the P/E ratio is just one piece of the puzzle. It should be analyzed alongside other financial metrics, and a company’s fundamentals should be thoroughly examined.
FAQ
What is a good price-to-earnings ratio?
A good P/E ratio is typically lower than the average, which falls between 20 and 25. This means that the stock’s price is relatively low compared to its earnings per share. However, other factors, such as industry and market conditions, should be considered when evaluating a P/E ratio.
Is a low PE ratio good?
Yes, having a lower P/E ratio can be advantageous for investors as it means they are paying less for each dollar of company earnings. This can make the stock more appealing to those looking for value investments.
Is a negative PE ratio bad?
Not always. It can indicate that a company is currently losing money, but this doesn’t automatically make it a bad investment. Many successful businesses have faced temporary losses before turning things around.
Is the PE ratio a good indicator?
Yes, the price-earnings ratio is a popular method for valuing stocks. While it should not be the sole factor in evaluating a stock, it can provide valuable insight when used with other metrics and factors.


