What Is a Bear Flag Pattern? Trading with Bearish Flags
Oct 09, 2024

Analysis of dynamic cycles of price shifts of financial assets in capital markets allows for accurately forecasting market sentiments and predicting future trends. In the analysis process, graphic patterns are often used as a guide to form an idea of the current trend of price movement. In the case of bearish sentiment, one of the key indicators is the bear flag pattern.
This article will tell you what a bear flag pattern is and its components. You will also learn what indicators are used to analyze it and what steps should be taken to find and analyze such a pattern on the chart.
Key Takeaways
- A flag pattern is a chart formation that features a brief countertrend (the flag) following a rapid trend movement (the flagpole).
- These patterns are typically accompanied by notable volume changes and distinct price action.
- Flag patterns indicate potential trend continuations or breakouts after a phase of consolidation.
What Is a Bear Flag Pattern?
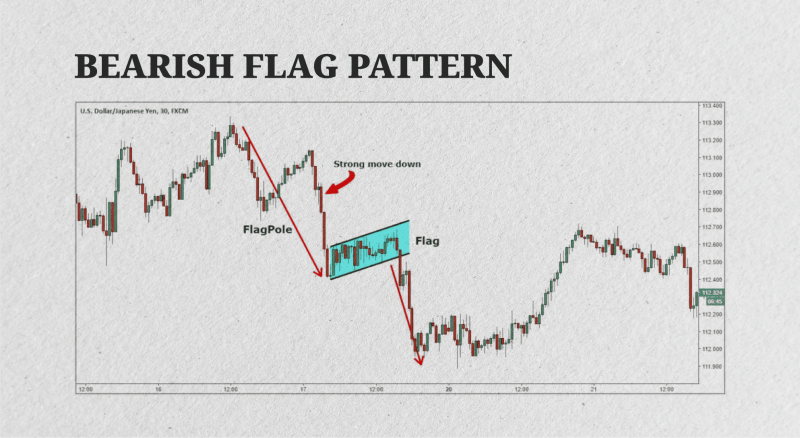
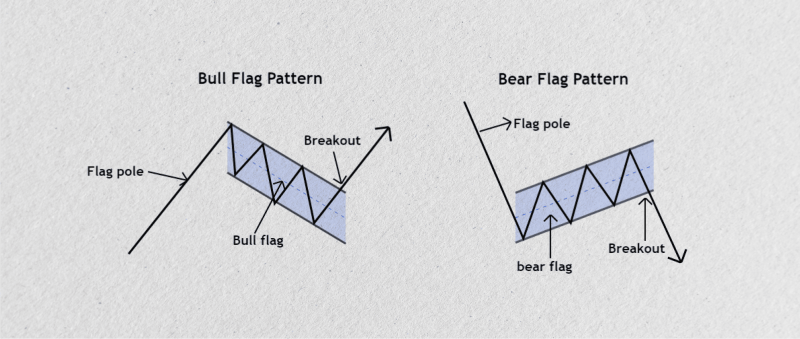
A bear flag pattern is a technical analysis formation that indicates the likelihood of a continuing downtrend in the market. This pattern usually emerges following a significant price decline, referred to as the “flagpole,” which is then succeeded by a phase of consolidation or a minor upward retracement known as the “flag.”

The presence of a bear flag pattern implies that after this temporary stabilization or upward movement, the price is expected to resume its downward trajectory. Traders often interpret this formation as a signal to anticipate further declines in the market.

Recognizing a bear flag pattern can be crucial for investors looking to capitalize on ongoing bearish trends. By understanding the dynamics of this formation, traders can make informed decisions about entry and exit points, enhancing their overall trading strategy.
Fast Fact
Flag patterns are marked by shifts in both volume and price. In a general flag pattern, volume increases during the initial trend movement and then decreases or remains steady during consolidation.
Key Components of a Bear Flag Pattern
The bear flag pattern is one of the most common patterns in electronic trading on the financial markets and is one of the key indicators of a downtrend. Along with other patterns indicating a downtrend, the bear flag is the most practical and has the following characteristics:
Flagpole
The first step is a steep downward movement that forms the flagpole. This signifies a strong bearish momentum, usually accompanied by intense selling and high trading volume. The sharper the flagpole, the more robust the trend.
Flag
During consolidation, the price typically moves sideways or experiences a slight upward trend, often forming a channel that slopes in the opposite direction of the previous downtrend. This phase signifies a temporary pause in the bearish movement as sellers capitalize on profits and buyers temporarily gain control, leading to a market equilibrium period.

Breakout
When the price breaks out of the consolidation zone in the flag pattern, it indicates the resumption of the downtrend. This breakout is often accompanied by higher trading volume, which acts as a signal for the continuation of the bearish movement.
Volume
Volume is an important factor in validating the bearish flag pattern. When there is a high volume during the formation of the flagpole, followed by a decrease in volume during the consolidation of the flag, it usually indicates a reliable pattern. Additionally, a surge in volume during the breakout further reinforces the continuation of the downtrend.
Indicators and Tools That Complement the Bear Flag Pattern
Since the bear flag pattern is the most common pattern in downward market trends, there are a number of indicators, metrics, and tools that make it possible to analyze bearish movement in practice. These indicators are:

Moving Averages
Use short-term moving averages (e.g., 9 or 20-period EMA) to identify the overall trend. When the price is consistently below these averages, it confirms the downtrend, reinforcing the bear flag setup.
Relative Strength Index (RSI)
RSI can help confirm overbought or oversold conditions. In a bear flag, the RSI may pull back slightly during consolidation but stay below 50, signaling continued bearish momentum.
Volume Indicators
Volume analysis is crucial for bear flags. Use tools like Volume Profile or On-Balance Volume (OBV) to track how volume behaves during the pattern. Decreasing volume during the flag and a surge during the breakout confirm the setup.
Fibonacci Retracement
Fibonacci levels can help identify potential retracement zones. The consolidation (flag) should retrace no more than 38.2% to 50% of the initial flagpole.
Bollinger Bands
During consolidation, Bollinger Bands will often contract as volatility decreases. A price break below the lower band during the breakout can confirm the continuation of the downtrend.
Step-by-Step Guide to Spotting a Bear Flag on a Chart
As mentioned earlier, the bear flag is one of the most common patterns indicating the reversal of the market trend into a downtrend after consolidation. As practice shows, detecting and analyzing such a pattern is a series of steps and helps to get a clear idea of further price movement. These steps are scarce:
Identify a Strong Downtrend
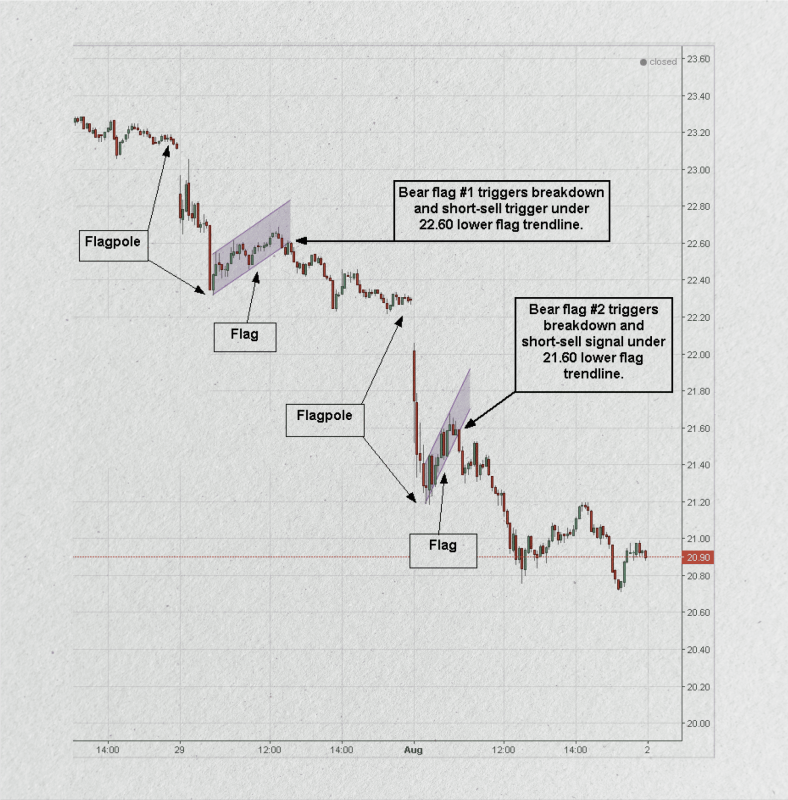
Keep an eye out for a significant and rapid decrease in price, creating what is known as the “flagpole.” This decline should be steep within a relatively brief timeframe, indicating robust selling momentum.
Watch for a Consolidation Phase
Following an initial decrease, the price will enter a period of consolidation characterized by movement within a narrow range or a slight upward retracement. This consolidation phase creates a “flag” pattern, which typically slopes slightly upwards or moves sideways. During this time, the trading volume is generally lower than the volume during the flagpole formation.
Look for Parallel Lines
When drawing parallel trend lines around the consolidation area, ensure that the upper line touches the most recent highs and the lower line connects the recent lows. This channel represents the flag portion of the pattern.
Wait for a Breakdown
Once the price breaks below the lower boundary of the flag pattern with a higher-than-average trading volume, it confirms the pattern. This break indicates the potential continuation of the downtrend, suggesting a favorable opportunity for a short position.
Monitor Volume
In bear flags, it’s important to pay attention to the volume. Look for a decrease in trading volume during the consolidation phase and a sudden spike during the breakout to validate the pattern.
Conclusion
A bear flag pattern is a significant technical analysis tool that signals a continuation of a downtrend after a brief period of consolidation. By recognizing the flagpole and flag structure, traders can figure out potential entry points for short positions, set effective stop-loss orders, and establish profit targets based on the height of the flagpole.
While bear flags can be reliable indicators, it’s crucial to complement them with additional analysis and indicators to enhance trading decisions. Understanding and applying this pattern can help traders navigate bearish market conditions more effectively.
FAQ
What Is a bear flag pattern?
A bear flag pattern is a technical analysis formation indicating a potential downtrend continuation after a brief consolidation period.
What timeframes are best for trading bear flags?
Bear flags can form on various timeframes, but shorter timeframes (e.g., 1-hour, 4-hour) may provide more actionable signals for day traders.
Can bear flags occur in bullish trends?
Bear flags specifically indicate a continuation of a downtrend. Similar patterns would be considered bullish flags in a bullish trend.
How reliable are bear flag patterns?
While bear flags can be effective indicators, no pattern is foolproof. Using other technical metrics and market analysis to confirm signals is essential.
What other indicators can I use with bear flags?
Combining bear flags with volume analysis, moving averages, or momentum indicators (like RSI) can enhance the reliability of your trading signals.


