Year-Over-Year (YoY): What It Means? How It’s Used in Finance?
Feb 07, 2025

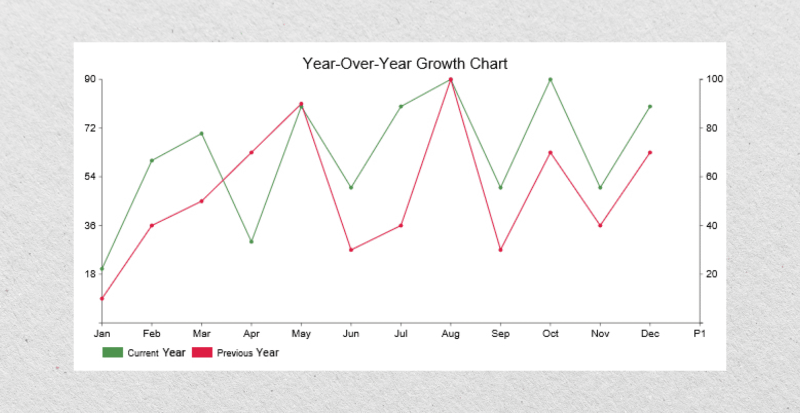
In the financial world, investors and businesses use various measures and analytics to evaluate performance, profitability, and broader economic conditions. In many of these analyses, you will come across “Year-Over-Year,” especially when looking at graphs and price charts.
There are different ways to calculate your YoY, whether for your self-proprietorship firm, large corporation, or just to measure market performance. Here’s how to calculate YoY growth and where to use it.
Key Takeaways:
- Year-over-year compares performance over a 12-month period, eliminating seasonal spikes.
- YoY is commonly applied to revenue, profits, inflation, and GDP analysis.
- Common limitations of the YoY include one-off events and lack of context during sudden price changes.
Understanding Year-Over-Year Meaning
The Year-over-Year (YOY) compares a financial or economic metric from one year to the same period the previous year. It helps identify trends without involving seasonal effects, such as holiday-related sales spikes or weather-related fluctuations.
For instance, you can compare Q1 2023 revenue with Q1 2022 to gain a clearer perspective on the growth percentage than by looking at month-to-month data.
YOY is essential in assessing performance consistency, identifying long-term patterns, and comparing growth across various sectors. From businesses evaluating financial statements to governments analyzing fiscal annual data, YOY is a critical tool for objective, time-based measurement.

How to Calculate Year-Over-Year Growth?
The year-over-year growth formula is simple and can be done in two ways:

The first formula calculates the absolute difference between the preceding and current year’s value, divides it by the previous year’s value, and then multiplies it by 100 to express it as a percentage.
The other method is quite similar. However, it subtracts 1 to isolate the percentage increase and multiplies by 100 for the percentage.
Importance of YoY in Finance

YoY calculations are vital in financial calculations as they evaluate long-term growth, eliminate short-term volatility, and identify the resulting trends. They provide businesses and investors with a consistent framework to measure progress and make fact-based decisions. Here’s how YoY applies to key financial metrics.
Revenue
Year-over-year revenue growth shows how much income a business generates over time. It highlights sales trends, while managers must decide whether the YoY change is influenced by market demand, pricing strategies, or expansion efforts.
A consistent year-over-year uptrend in revenue is a positive indicator of a company’s ability to sustain its market position and attract customers.
Cost of Goods Sold
YOY in cost of goods sold (COGS) analysis highlights changes in production or procurement expenses. It helps businesses identify cost-saving opportunities or supply chain inefficiencies.
For example, if COGS grows faster than revenue, it could indicate declining profitability or increased material costs, suggesting a review of operations or ongoing production procedures.
Profit
Businesses use YoY analysis to measure profit and bottom-line growth. A positive annual growth indicates operational efficiency, while a declining trend may signal increased costs or declining revenue.
Investors use this metric to assess a company’s financial health and its ability to generate returns.
EBITDA
YoY can also be used in earnings before interest, taxes, depreciation, and amortization analysis (EBITDA) to eliminate the impact of non-operational costs, such as taxes and interest, offering a clearer view of core profitability.
Consistent annual EBITDA figures reflect strong performance and operational management, making it a reliable metric for evaluating a business.
KPI
Managers use YoY metrics in Key Performance Indicators (KPIs) to assess progress towards strategic goals.
It can help with metrics like customer acquisition, retention rates, or website traffic, enabling businesses to identify what drives growth and what needs improvement.
Earnings Per Share
YoY in earnings per share (EPS) growth demonstrates how a company’s profitability is distributed among shareholders.
A rising EPS trend suggests improved earnings performance or efficient capital management, which can increase shareholders’ confidence and attract more investors. It’s a crucial metric for evaluating shareholder value over time.
Financial Indicators That Use The YOY Growth Formula
Analyzing the YoY growth rate is essential for interpreting macroeconomic trends. Policymakers, economists, and analysts rely on it to evaluate critical indicators that shape economic decisions. Here are key indicators that rely on YoY calculations:
Inflation
YoY in inflation studies price levels over 12 months, helping central banks adjust monetary policy and curb currency and price instability.
For instance, if inflation rises from 3% to 5% in year-over-year calculations, it signals an increased cost of living, requiring interest rate hikes to stabilize the economy.
Unemployment Rates
YoY unemployment rates measure changes in job creation and economic health. A declining unemployment rate in year-over-year numbers reflects job market growth, while an increase may indicate economic downturns or structural issues requiring policy intervention.
Interest Rates
Central banks monitor annual changes in interest rates to manage economic stability. Rising YoY rates typically indicate efforts to curb inflation, while declining rates aim to stimulate borrowing, spending, and investments during slowdowns.
GDP
YoY GDP changes reflect a country’s economic progress. Positive growth rates refer to expanding economic activity, while a decline may indicate recessionary pressures.
Annual gross domestic product (GDP) analysis helps governments and investors track national economic health and development trajectory.
Key Applications of Year-Over-Year Calculations
YoY calculations have various applications across a company’s performance tracking, stock market analysis, and macroeconomic assessments. By comparing annual changes, stakeholders can make informed decisions and identify growth opportunities. Here are the primary applications:
Business Performance Analysis
Year-over-year analysis helps businesses evaluate their financial health, operational efficiency, and market trends. Decision-makers use metrics such as revenue, profit, and expenses measured over the past year to gain insights into the company’s long-term performance or identify areas for improvement.
Stock Market Analysis
Stock traders use YoY data to compare a company’s earnings, revenue, and share growth trajectory against competitors. Market participants use these calculations to find growing stocks and shift their investments accordingly.
Moreover, this analysis helps business owners identify undervalued or growing corporate stocks, guiding institutional-wide portfolio decisions based on historical performance trends.
Economic Indicators
Governments and economists use year-over-year figures to track macroeconomic trends like inflation, gross domestic product, and unemployment.
These comparisons help craft monetary and fiscal policies, assess economic stability, optimize governmental intervention, and predict future growth.
Investor Decision-Making
YoY data enables investors to identify consistent growth patterns in companies or industries. By analyzing annual trends in financial metrics, investors can identify potential returns and risks, ensuring more data-driven investment decisions.
YoY vs MoM
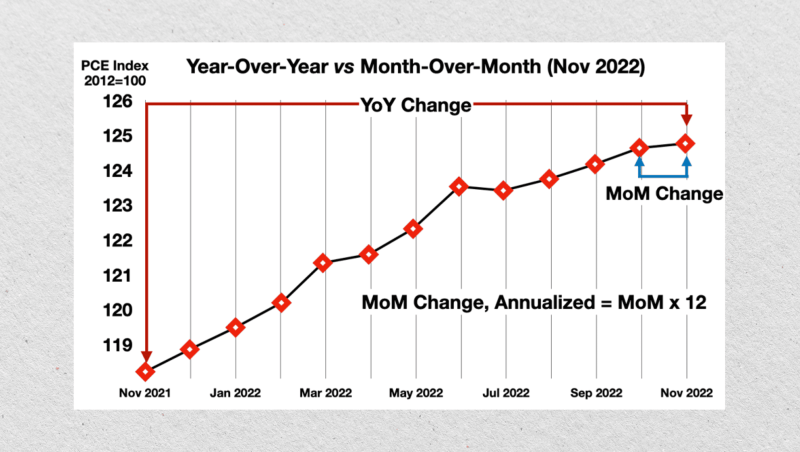
Besides YoY calculations and analysis, investors use month-over-month (MoM) and quarter-over-quarter (QoQ) to compare performances in given periods.
Each measure serves a distinct purpose. YOY for annual trends, MoM for short-term insights, and QoQ for quarterly performance analysis. Let’s explain the differences.

Year-over-Year (YOY)
Year-over-year (YOY) compares a financial or economic metric from one year to the same period in the previous one. This eliminates seasonal effects, providing a clear view of long-term trends.
For example, comparing Q1 revenue from 2024 to Q1 revenue from 2023 reveals sustained growth or decline without being distorted by seasonal fluctuations. YOY is particularly useful for evaluating annual progress in metrics like revenue, profit, or inflation.
Month-over-Month (MoM)
Month-over-Month (MoM) focuses on short-term changes by comparing one month’s performance to the previous month. This measure captures immediate shifts in performance, such as the impact of a marketing campaign or a sudden market event.
While MoM is ideal for detecting trends within a shorter timeframe, it’s more prone to seasonal distortions, such as holiday sales spikes or weather-related impacts, making it less reliable for long-term analysis.
Quarter-over-Quarter (QoQ)
Quarter-over-quarter (QoQ) compares the current quarter’s performance with the previous quarter, offering a medium-term perspective.
It balances the immediate effect of MoM and the long-term focus of YOY, making it ideal for industries with seasonal variations, such as retail or tourism. QoQ is often used to measure trends in earnings, GDP, or sales during quarterly financial reporting cycles.
Limitations of The YOY Formula
While the YoY formula is a powerful tool for analyzing long-term trends, it contains some challenges that can affect its accuracy and interpretation.
- Seasonal Distortions: While YoY is not affected by seasonality, it may be affected by inconsistent holidays or sudden demand hikes.
- One-Off Events: Unusual occurrences, such as business mergers or natural disasters, can massively influence YoY comparisons.
- Lack of Details: YoY focuses on 12-month outcomes and overlooks short-term changes, making it less useful for detecting immediate trends.
- No Qualitative Context: Year-over-year focuses on quantitative outcomes but ignores qualitative factors affecting them.
- Dependence on Consistent Data: Inconsistent or incomplete data can lead to misleading results, creating biases or outlayers.
Conclusion
The year-over-year analysis is central to various financial, economic, and business activities. It calculates the percentage change in a given metric, such as revenue or profit, by comparing it to the same period in the previous year.
It is a powerful tool for tracking long-term trends and eliminating seasonal biases. YoY has multiple applications in a company’s financial performance, stock market changes, and macroeconomic indicators, making it indispensable for financial decision-making.
It can be optimized by combining it with other metrics to account for short-term changes and one-off events.


