Best Technical Analysis Indicators
June 16, 2023
Throughout history, people have always looked for ways to make money, and trading has become a popular choice today. But successful trading isn’t about luck or guesswork – it requires careful analysis to make the right decisions. This kind of analysis, known as technical analysis, started way back in the 17th century Amsterdam market and with Japanese rice trading in the 18th century.
Thanks to technology, we now have hundreds of different trading indicators that help us understand the market better.
This article will explain the technical analysis and introduce some of the most popular technical indicators you can use.
Key Takeaways
- Technical analysis is a method traders use to understand market trends and forecast future price movements.
- A technical indicator is a mathematical calculation based on the price, volume, or open interest of a security or contract that helps traders identify specific patterns and trends in the market.
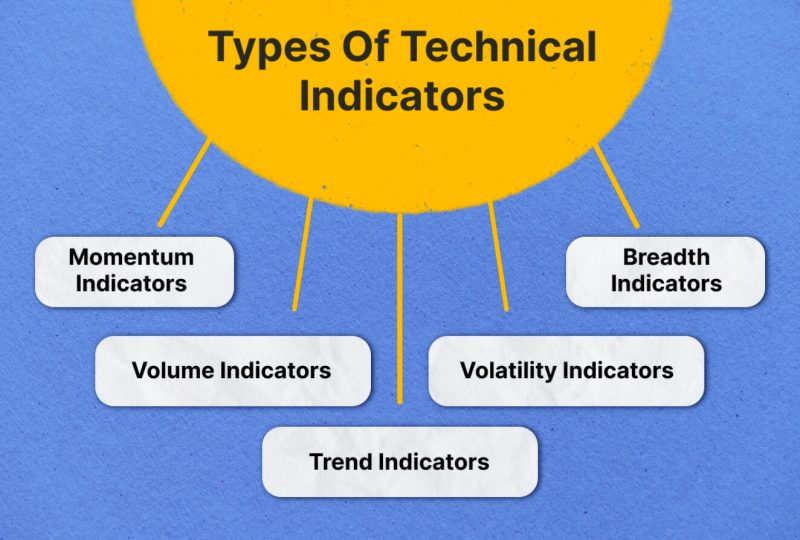
- There are several types of technical indicators: trend indicators, momentum indicators, volume indicators, volatility indicators, and breadth indicators.
- Choosing the right indicator depends on your trading strategy and the specific market conditions. Remember, no single indicator provides a complete picture.
What Is Technical Analysis?
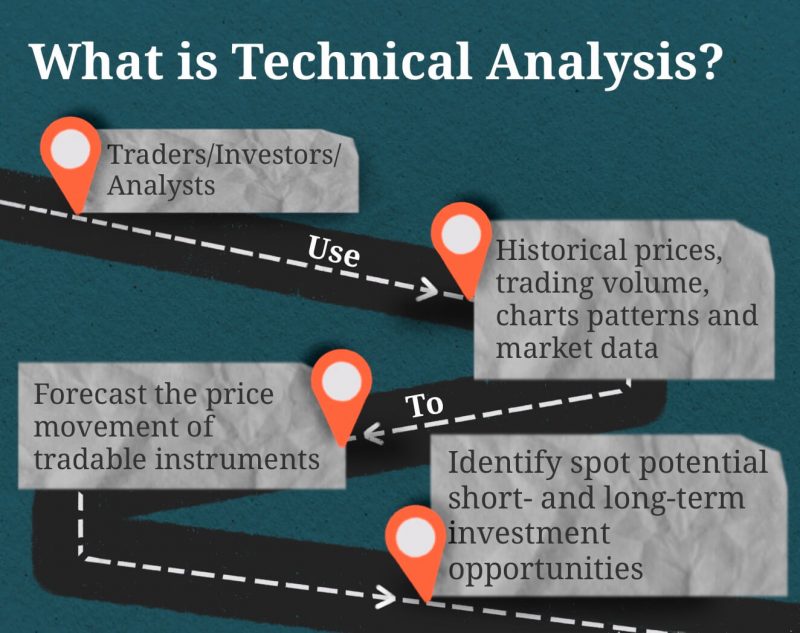
Technical analysis serves as a crucial discipline within the trading sphere, which aids in assessing investments and pinpointing trading opportunities. It accomplishes this by scrutinizing statistical trends derived from trade activities such as price fluctuations and trading volume.
This approach diverges significantly from the methodology of fundamental analysts. Instead of striving to ascertain a security’s inherent value from financial or economic data, technical analysts concentrate on discerning patterns in price movements. They also utilize trading signals and analytical charting instruments to gauge a security’s robustness or potential vulnerabilities.
The beauty of technical analysis is that it can be applied to virtually any security with historical trading data. This broad spectrum encompasses stocks, futures, commodities, fixed-income securities, currencies, and more.
The principles we’ll explore universally apply to all types of securities. Interestingly, technical analysis is widespread in the commodities and forex markets, where traders often concentrate on tracking and predicting short-term price trends.
Understanding Technical Indicators: How Do They Work?
Technical indicators are analytical tools predominantly concerned with historical trading data, such as price, volume, and open interest. Rather than focusing on a business’s fundamental aspects like earnings, revenue, or profit margins, these indicators prioritize past market behavior.
They are widely utilized by active traders aiming to analyze short-term price fluctuations. However, long-term investors may also find value in these tools, using them to determine optimal entry and exit points in the market.
Technical indicators apply mathematical formulas to past trading data, generating data points from previous price, volume, and open interest information. These indicators are typically presented in a graphical format, making it possible to compare them directly with corresponding price charts for comprehensive analysis.
The function of a technical indicator essentially encapsulates the market’s behavior and, in some instances, the investors’ psychology. Thus, it offers valuable insights into potential future trends in price activity.
Types Of Technical Indicators
Technical Indicators can be divided into four categories:
- Momentum Indicators
- Volume Indicators
- Trend Indicators
- Volatility Indicators
- Breadth Indicators
So, let us discuss these technical indicators in detail.
Momentum Indicators
Momentum indicators are invaluable tools traders employ to gauge the rate at which the price of a security is shifting. These indicators offer insights into the speed or ‘momentum’ of price changes rather than the direction of the movement. Therefore, momentum indicators are best utilized alongside other analytical tools and indicators for a comprehensive understanding of the market.
The primary purpose of momentum indicators is to provide traders with a clearer understanding of the velocity at which the price of a specific security is changing, giving insights into the power or strength of price movements.
Stock prices do not always move at the same pace. They can plummet quickly or slowly, just as they can surge rapidly or gradually. Momentum indicators help to analyze these fluctuations in pace, thus enabling traders to monitor the speed of a stock’s rise or fall.
A diverse array of momentum indicators are available to traders, each offering unique insights and aiding in measuring price change speed. Let’s take a look at some of the best trading indicators of this category.
- Moving Average Convergence Divergence (MACD)
The Moving Average Convergence Divergence, often shortened to MACD, is a momentum-based technical indicator that shows the relationship between two moving averages of a security’s price. The MACD is calculated by subtracting the 26-day Exponential Moving Average (EMA) from the 12-day EMA.
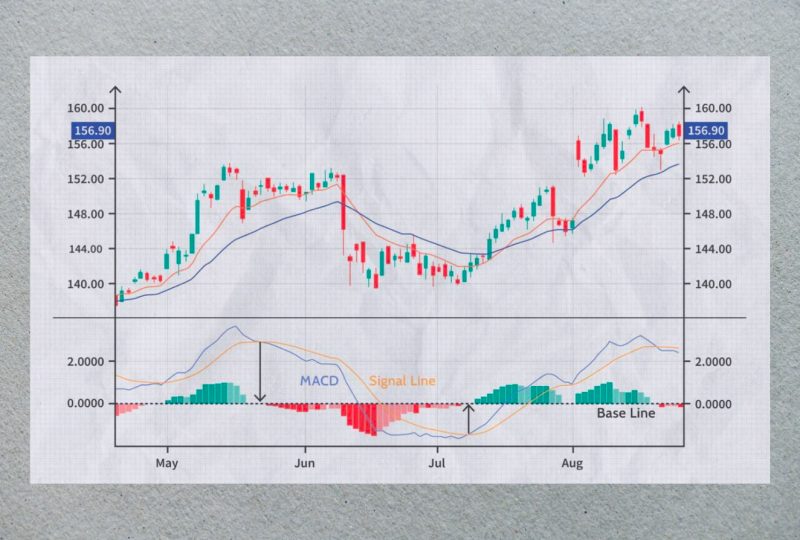
The result is depicted as a line, often paired with a 9-day EMA signal line to trigger buy and sell signals. Additionally, MACD histograms, which plot the distance between the MACD line and its signal line, are used to identify convergence and divergence, hence the name.
- Relative Strength Index (RSI)
The Relative Strength Index, or RSI, is a popular momentum oscillator that measures the speed and change of price movements. RSI values range from 0 to 100. Generally, a security is deemed overbought when the RSI exceeds 70 and oversold when it falls below 30.
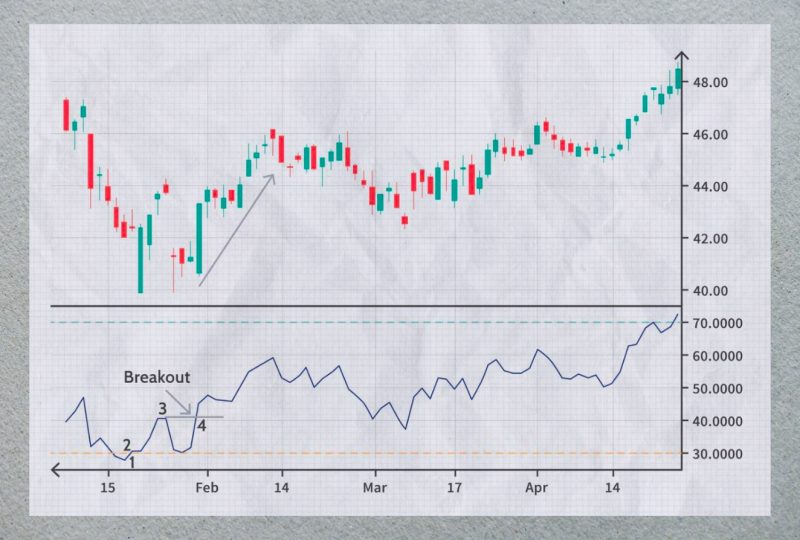
This indicator can also identify potential price reversals through divergence and convergence and helps traders determine market conditions that may precede either a rally or a downfall.
- Average Directional Index (ADX)
The Average Directional Index, abbreviated as ADX, is a technical analysis tool that measures the strength of a trend but does not indicate its direction. It’s usually combined with +DI and -DI (Directional Movement Indicators) to determine the trend direction.
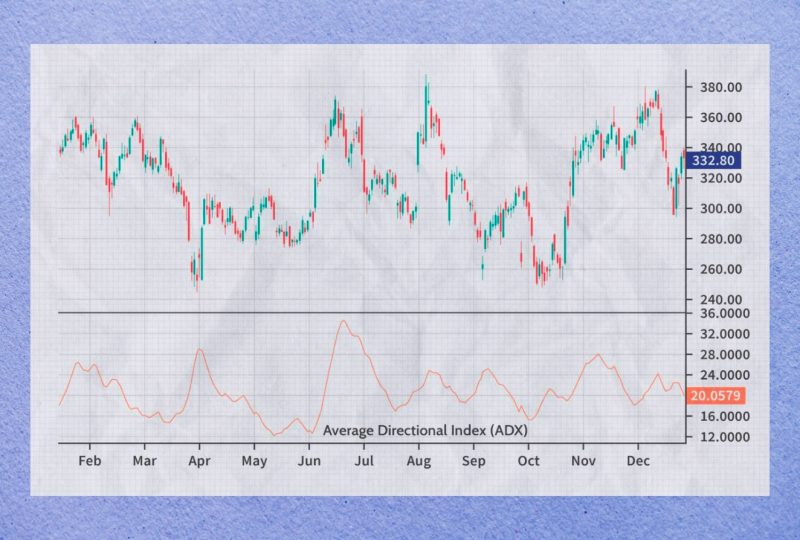
The ADX ranges from 0 to 100, with values over 25 indicating a strong trend and values below 20 suggesting a weak or range-bound market.
- Rate of Change (ROC)
The Rate of Change, or ROC, is a momentum-based technical indicator that measures the percentage change in price between the current price and the price a certain number of periods ago. In essence, the ROC oscillates around a zero line, indicating a positive or negative rate of change.
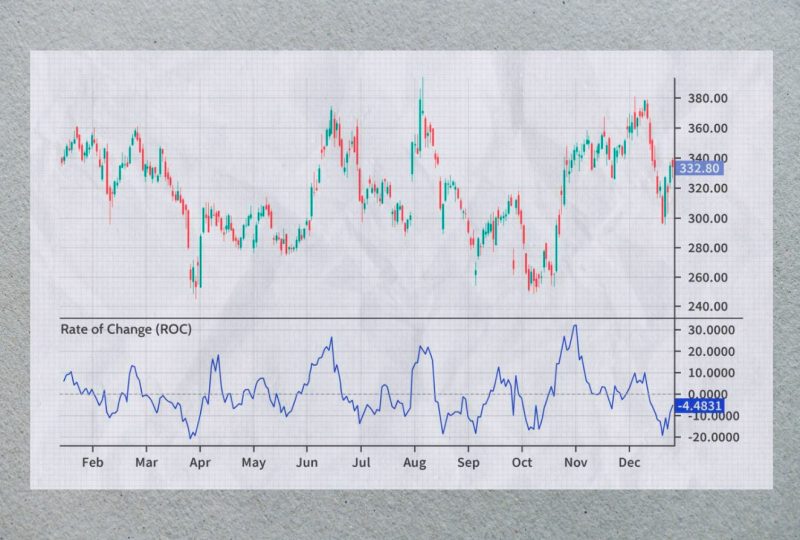
This assists traders in identifying potential buy or sell opportunities when the ROC crosses the zero line.
Volume Indicators
Volume indicators represent a vital but often overlooked aspect of technical analysis, particularly among beginner traders. However, the role of volume in confirming trends and patterns is substantial, thus underlining its importance in comprehensive market analysis. These technical indicators reflect the number of stocks traded within a specific period, offering insights into market participants’ trading behavior and perceptions.
One notable advantage of volume indicators is their predictive capability. They often precede price movements, providing early signals about possible continuations or reversals in price trends. As such, volume indicators are highly beneficial tools for traders seeking an edge in the market.
Let’s learn more about a few popular volume indicators.
- Volume Price Trend Indicator
The Volume Price Trend Indicator (VPT), or Price and Volume Trend (PVT), combines price and volume to show the cumulative total volume adjusted for price changes. In essence, it’s an enhancement of the On Balance Volume (OBV) indicator and operates under the belief that changes in volume are often a precursor to new trends in price.
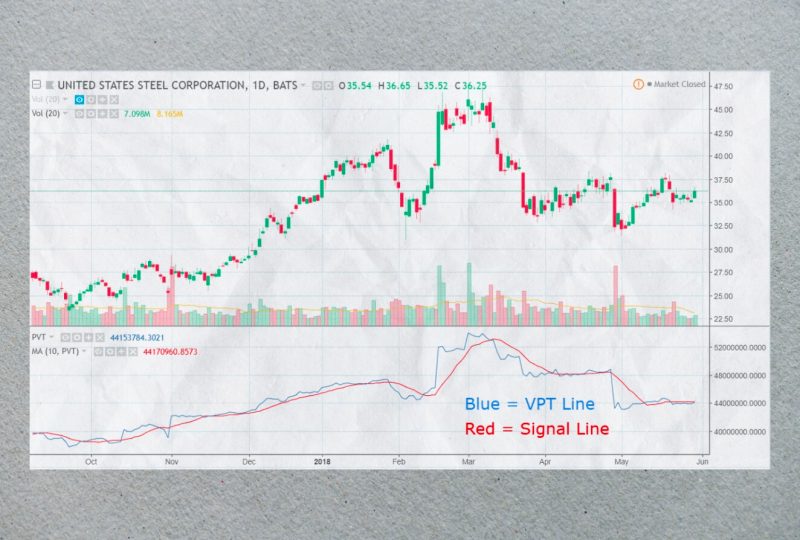
The VPT is calculated by multiplying the change in price from one period to the next by the volume for the current period, then adding this to the previous VPT value. This indicator can help identify new trends and confirm the strength of existing ones.
- Money Flow Index (MFI)
The Money Flow Index (MFI) is a volume-weighted oscillator that uses price and volume data to identify overbought or oversold conditions in an asset. It’s often called the “volume-weighted RSI” as it integrates volume data into the Relative Strength Index (RSI) formula. MFI values range from 0 to 100, with values above 80 typically indicating overbought conditions and those below 20 indicating oversold conditions.
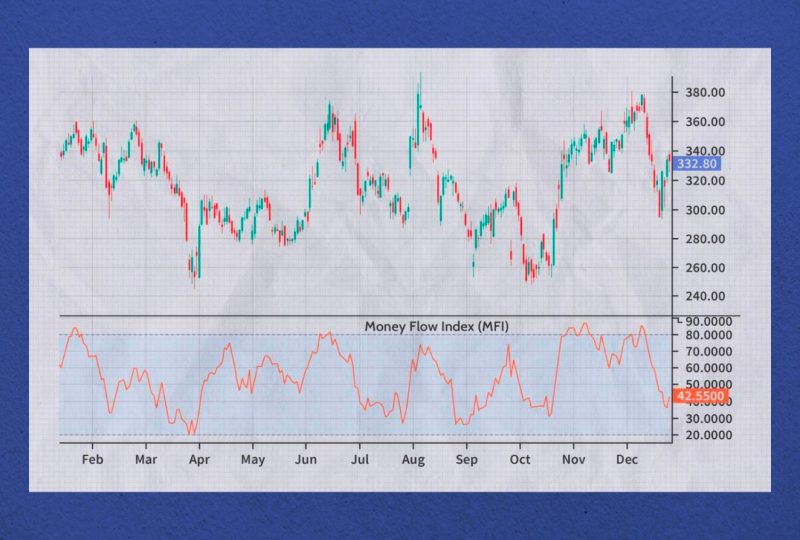
This indicator helps traders identify potential price reversals, providing an opportunity for profitable entries or exits. Additionally, MFI can generate divergence signals that may precede possible trend reversals, offering traders an extra layer of analysis.
Trend Indicators
Trend indicators serve as vital tools for traders who subscribe to the trend trading methodology. In trend trading, traders typically take a long position when they identify an upward trend in a stock’s price, while a downward trend prompts initiating a short position.
The primary goal of trend trading is to profit from following the market’s direction. This strategy capitalizes on a stock’s momentum as it moves in a particular direction, which could either be upward or downward. Trend indicators come into play by helping traders scrutinize and predict whether a trend is likely to persist or undergo a reversal.
Below are the most popular trend indicators:
- Moving Averages
Moving Averages (MAs) are one of technical analysis’s simplest yet most widely used trend indicators. They smooth out price data to create a single flowing line, making it easier to spot overall trends. MAs are typically calculated by adding the closing price of a security over a set number of periods and then dividing this sum by the number of periods.
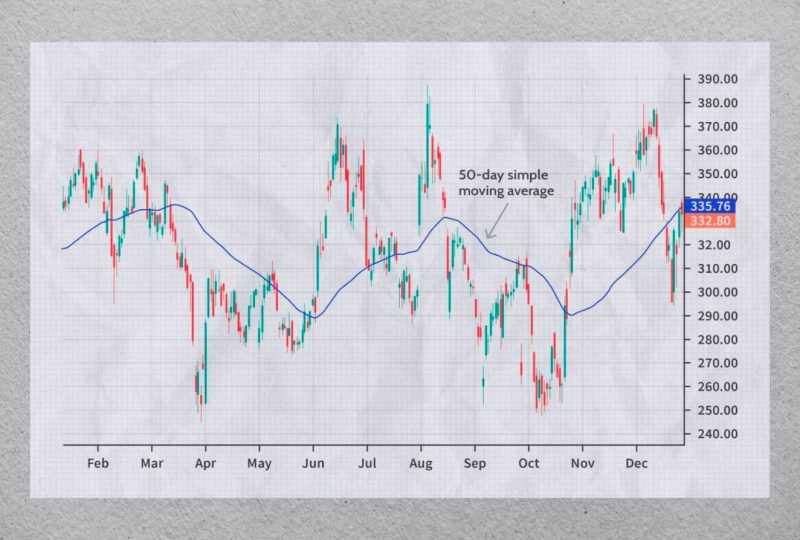
The two most common types are the Simple Moving Average (SMA) and the Exponential Moving Average (EMA), giving more weight to recent prices. A rising MA suggests an uptrend, while a falling MA indicates a downtrend. Additionally, crossovers of different period MAs (like a 50-day crossing a 200-day period) can signal trend changes.
- Supertrend
Supertrend is a trend-following indicator used to identify the direction of a security’s momentum. It’s primarily used in intraday trading and works best in a trending market. The supertrend is plotted on the price chart of the security and changes color based on the direction of the trend.
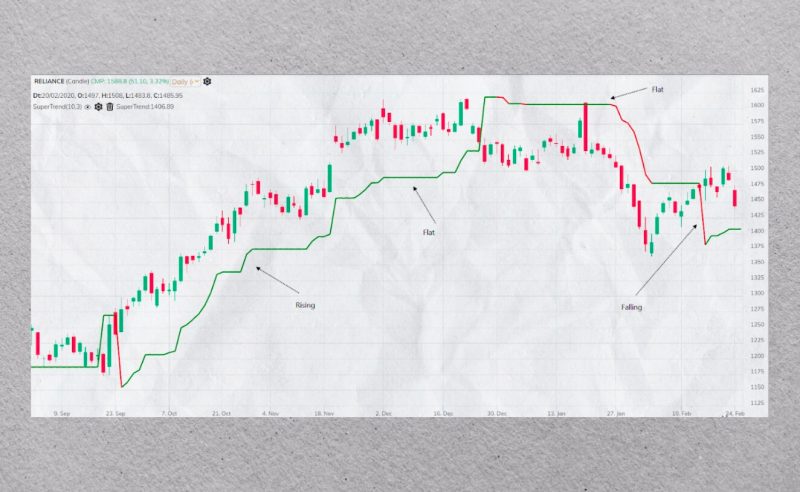
It turns green when an uptrend is detected and red when a downtrend is detected. The indicator remains the same colour until the trend reverses. This simple visual representation makes it easy for traders to identify and follow trends, aiding decision-making.
- Parabolic SAR
The Parabolic Stop and Reverse (SAR) is a sophisticated trend-following indicator that is particularly effective for capturing short-term trends. It positions dots on a chart to indicate potential reversal points: dots above the price indicate a downtrend, while dots below suggest an uptrend.
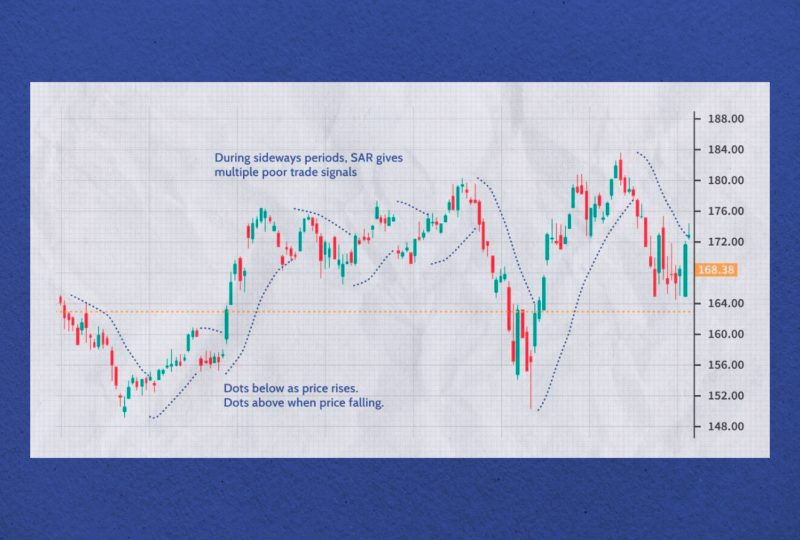
This placement helps traders to identify the right moment to enter or exit a trade. Additionally, the Parabolic SAR can be used to set stop-loss orders as the SAR level moves with the price, adjusting its position based on the direction the market is moving. This makes it a dynamic and adaptable indicator for managing market risk.
Volatility Indicators
Volatility Indicators play a crucial role in trading, extending beyond the simple assessment of whether the market is trending or consolidating. To navigate the unpredictable waters of stock trading effectively, it’s paramount for traders to familiarize themselves with volatility indicators.
During volatile periods in the stock market, significant swings can occur, often triggered by impactful news or events, making trading particularly challenging. These shifts can result in either high volatility, often observed when the market is trending, or low volatility, typically occurring during the market’s consolidation phase.
These technical indicators serve as invaluable tools that enable traders to measure and understand these dynamic periods of market volatility. Let’s take a look at some of the most popular volatility indicators.
- Bollinger Bands
Bollinger Bands are a volatility indicator used extensively in technical analysis. They consist of three lines: a Simple Moving Average (SMA) in the middle and two standard deviation lines – one above and one below the SMA. These bands expand and contract based on market volatility.
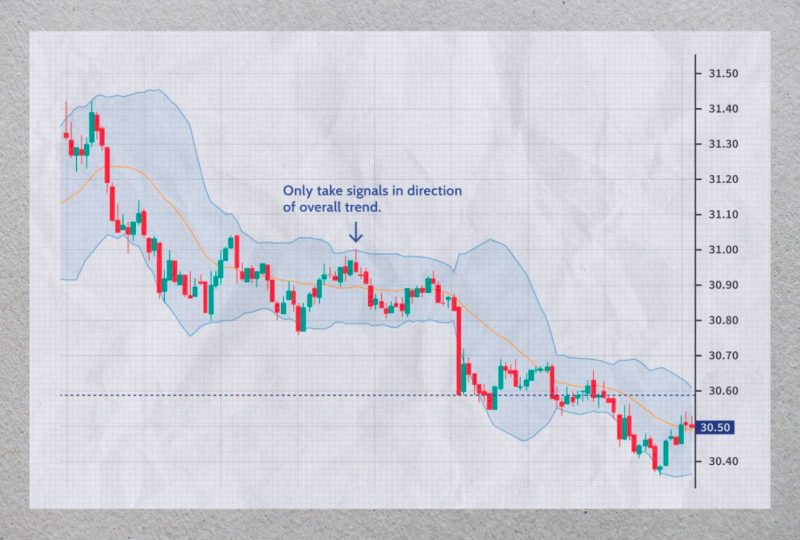
When the bands widen, it suggests increased volatility; when they narrow, it signifies decreased volatility. Traders often use Bollinger Bands to identify overbought or oversold conditions. For instance, a price that touches or exceeds the upper band might be considered overbought, while a price at or below the lower band could be considered oversold.
Moreover, Bollinger Bands can help traders identify potential price breakouts, offering further insights into market movements.
- Donchian Channel
The Donchian Channel is a trend-following indicator that also assesses volatility. It consists of three lines: the upper band, lower band, and middle band. The upper band is set at the highest price over a specified period, the lower band at the lowest price, and the middle band is the average. As the distance between the upper and lower bands increases, it indicates higher volatility and vice versa.
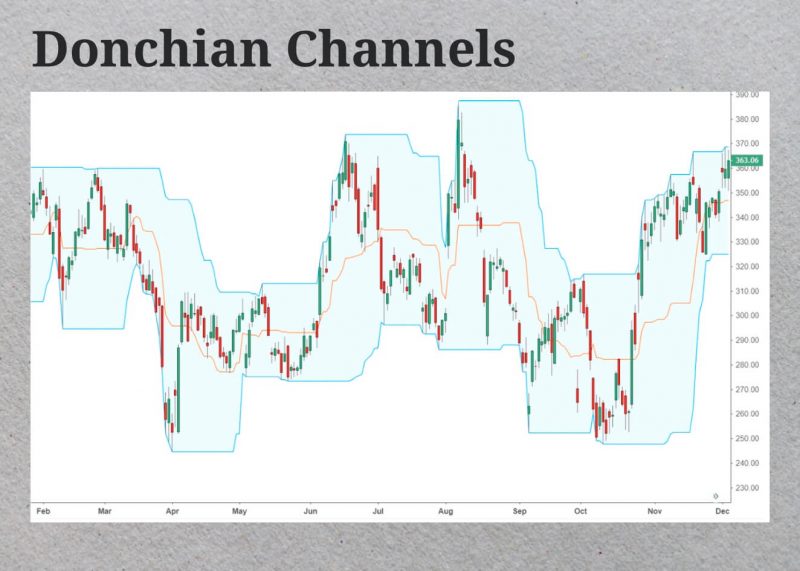
Traders use the Donchian Channel to identify potential breakouts or breakdowns. For instance, a breakout is often signaled when the price crosses above the upper band, while an analysis may be indicated when the price falls below the lower band.
- Average True Range (ATR)
The Average True Range (ATR) is a technical analysis indicator that measures market volatility by decomposing the entire range of an asset price for that period. Initially introduced by J. Welles Wilder, the ATR calculates the average of accurate price ranges over a specified period.
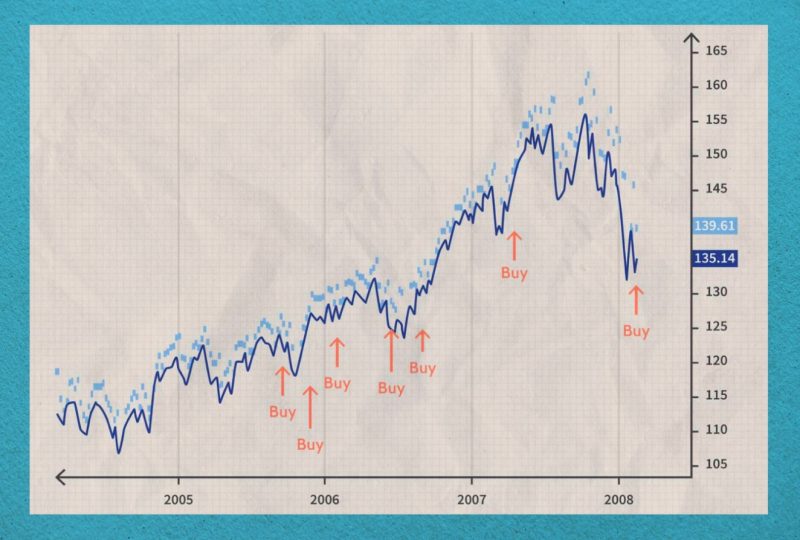
The ‘true range’ is the largest value among the current high minus the current low, the absolute value of the recent high minus the previous close, and the current low minus the previous close. A higher ATR indicates higher volatility, while a lower ATR suggests lower volatility. Traders often use the ATR to calculate their potential stop loss levels.
Breadth Indicators
Market Breadth, as an indicator, serves as a reflection of market participants’ behavior. Its interpretation can take several forms, providing insights into various aspects of the trading environment. For instance, Market Breadth can indicate the number of stocks contributing to a market rally or the volume of active investors at any given time.
A fundamental inquiry that arises during market rallies revolves around the sustainability of these upward movements. The extent of market participation largely determines this sustainability.
A rally characterized by a broad Market Breadth is often deemed more enduring, suggesting that a diverse array of stocks drive momentum upward. Such a scenario typically connotes a healthy and robust market condition.
Conversely, a rally accompanied by a diminishing Market Breadth signals a potential decline in market confidence. In such cases, fewer stocks contribute to the rally, which may imply that the bullish trend is losing steam and might be nearing its end. Thus, Market Breadth is an essential tool for investors looking to gauge the strength and validity of market trends.
- Periodic High and Lows
Periodic Highs and Lows are straightforward breadth indicators used to identify trends and reversals in the market. This indicator tracks the number of stocks that reach new highs or lows over a specified period. A market showing an increasing number of new highs suggests a strong upward trend, and conversely, a market showing a growing number of new lows indicates a downward trend.

However, if the market is making new highs, but the number of individual stocks making new highs is decreasing, it could be a sign of an impending trend reversal, suggesting that the upward momentum is losing steam.
- Percent/Number of Stocks Above Moving Average
The Percent or Number of Stocks above a particular Moving Average is another useful breadth indicator. This indicator tracks the number of stocks trading above a specific moving average (like a 50-day or 200-day MA) and expresses this as a percentage of the total number of stocks. A high percentage implies strong bullish sentiment as most stocks participate in the upward trend.

Conversely, a low percentage could suggest bearish sentiment. This indicator provides a broad snapshot of market sentiment and can help identify overbought or oversold conditions in the market.
- Advance/Decline Line
The Advance/Decline (A/D) Line is among the most popular breadth indicators. It measures the number of advancing stocks (stocks that have increased in price) against the number of declining stocks (stocks that have decreased in price) over a particular period. The A/D Line is calculated by subtracting the number of declining stocks from the number of advancing stocks and then adding this value to the previous period’s A/D Line value.
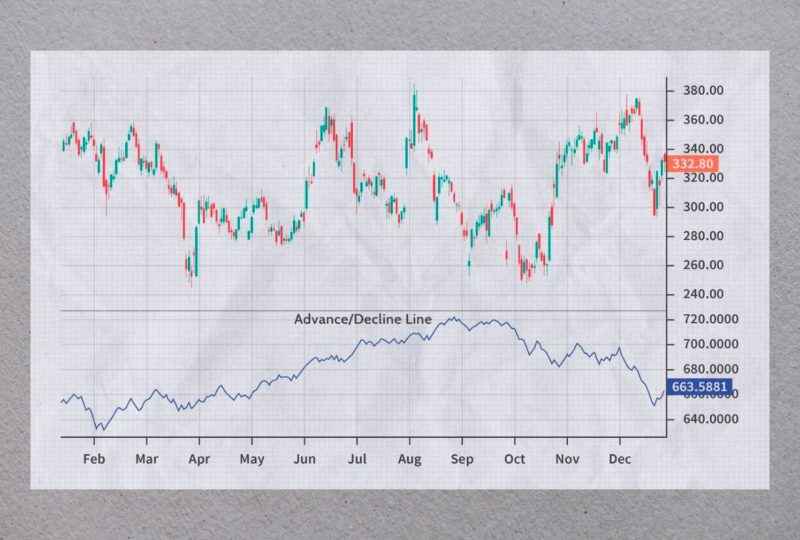
A rising A/D Line suggests that more stocks are participating in the uptrend, which is a bullish signal. A falling A/D Line, on the other hand, indicates more stocks are declining, which is a bearish signal. The A/D Line can confirm the overall market trend and detect potential divergences that could signal a trend reversal.
What To Consider When Using Technical Indicators
While technical indicators can prove invaluable for traders deciphering market conditions, they should not be mistaken for a comprehensive trading strategy. A trading strategy serves as a roadmap for traders, defining their actions under different market circumstances. Typically, traders incorporate multiple indicators into their strategy to provide a more holistic market view.
However, it’s crucial to diversify the types of technical indicators used to avoid redundancy. For instance, using multiple momentum indicators simultaneously might lead to overemphasizing the same information, a statistical issue known as multicollinearity. This redundancy can cloud the overall analysis and potentially undermine the importance of other variables.
To circumvent this pitfall, traders should select indicators from varied categories, such as combining a momentum indicator with a trend indicator. This approach helps create a more balanced and comprehensive analysis.
Furthermore, using multiple indicators can enable cross-verification, allowing one indicator to confirm the accuracy of signals generated by another. This multi-faceted analysis can significantly enhance the robustness of a trader’s strategy and improve the likelihood of successful trades.
Bottom Line
To wrap up, it’s clear that trading indicators are a big help in the trading world. They offer insights into market trends and help us make sense of the market’s twists and turns. However, they aren’t a magic solution for guaranteed success.
A good trader uses these indicators as part of a larger plan. It’s like using a GPS when driving – it helps you see the road ahead, but you still need to steer the car and decide when to speed up or slow down.
By mixing different indicators, traders can avoid focusing too much on one kind of information and get a clearer overall picture. Remember, trading is like a journey. It’s all about making the best decisions with the information you have. Using trading indicators wisely is one way to help you get where you want to go.

