Buy Side Liquidity And Sell Side Liquidity: What Are They?
Jan 14, 2025

Most market traders often focus on price action or fundamental data but overlook liquidity—a concept that underpins market movement. This concept holds particular significance in the Inner Circle Trader (ICT) methodology, highlighting the hidden dynamics of institutional market behavior. Within this framework, two pivotal terms emerge: buy side liquidity (BSL) and sell side liquidity (SSL).
This article will dive deep into the mechanics of liquidity, contrasting sell side vs buy side and exploring how traders can leverage these insights.
Key Takeaways
- BSL consists of buy-stop orders above resistance, while SSL involves sell-stops below support.
- ICT trading helps traders predict market moves by focusing on how institutions target these liquidity zones.
- Big players (like institutions) use tricks like stop hunts to take advantage of traders’ stop-loss orders.
- You can find liquidity zones by looking at support, resistance, and candlestick patterns.
What is Liquidity?
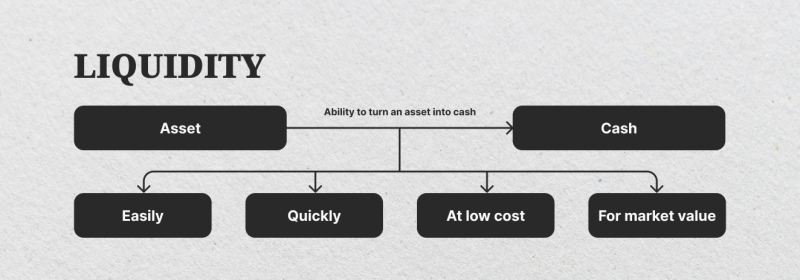
Liquidity is the backbone of financial markets. It represents the capacity to transact quickly and efficiently without causing significant price disruption.
Tighter bid-ask spreads, smoother price movements, and ample trading volume characterize markets with high liquidity. Conversely, low-liquidity markets often experience higher volatility and greater trading costs. This concept applies universally across asset classes, from equities to forex and even to alternative markets like cryptocurrencies.
Why Liquidity Matters
Liquidity influences not only market dynamics but also the profitability of trades. In liquid markets, participants can enter and exit positions with minimal slippage, enabling efficient trading.
However, in illiquid markets, even modest trades can lead to sharp price movements, which can impact execution costs. This underscores the importance of understanding where liquidity resides and how it interacts with market participants.
Key Players in Liquidity
Various participants drive liquidity in financial markets, each playing a unique role:
- Market Makers: Provide liquidity by continuously quoting buy and sell prices. Their role is pivotal in maintaining smooth market functioning and ensuring that other participants can execute trades at competitive rates.
- Institutional Investors: Banks, hedge funds, and other large players significantly influence liquidity through their substantial transactions. These entities often dominate market volumes and create ripple effects in pricing.
- Retail Traders: Though smaller in scale, they contribute to overall market activity. Retail traders’ collective actions, such as placing stop-loss orders, can create identifiable liquidity pools that institutions often target.
How Liquidity Supports Market Efficiency
Liquidity facilitates price discovery, ensures market efficiency, and plays a critical role in risk management. It enables smoother transitions between buyers and sellers and ensures that prices accurately reflect supply and demand dynamics.
For traders, understanding liquidity means gaining insight into the “why” behind price movements—an essential skill for aligning strategies with market realities.
The ICT Perspective on Liquidity
The Inner Circle Trader methodology approaches liquidity through the lens of institutional activity. ICT identifies how large market players systematically exploit areas of concentrated liquidity—a process often invisible to the average trader.
These organizations aim to find spots in the market where many trades are grouped, which helps them execute their large transactions efficiently. By learning these patterns, traders can adjust their strategies to align with institutions rather than lose out on their moves.
How ICT Views Liquidity
The ICT methodology introduces several core ideas that help traders understand how institutions use liquidity to move the market:
- Liquidity Pools (Levels): These are clusters of stop-loss orders that accumulate around key levels like support and resistance. Institutions aim to target these zones to generate the liquidity needed for their large transactions.
- Stop Hunts: This tactic involves intentional price movements that trigger retail traders’ stop-loss orders. By “hunting” stops, institutions create the liquidity they require, often resulting in sharp price reversals that leave retail traders out of position.
- Inducements: False breakout patterns or seemingly significant moves entice retail traders to enter positions prematurely. These movements serve as a trap, allowing institutions to capitalize on the subsequent reversal or continuation.
- Price Efficiency: ICT highlights how institutions use liquidity to ensure price efficiency. After exploiting liquidity levels, markets often gravitate towards areas of balance or “fair value,” a concept integral to ICT’s methodology.
- Order Flow: ICT’s unique focus on order flow provides a granular view of how liquidity operates. By tracking where orders are likely to accumulate, traders can more effectively anticipate shifts in price action.
Unlike relying on basic indicators, ICT focuses on understanding how institutions drive prices. This helps traders think ahead instead of reacting after prices move. By spotting liquidity zones, traders can improve their timing and overall results.
Fast Fact
The term “liquidity pools” is also widely used in the crypto industry, but it refers to something different: token pools locked in smart contracts to support trading on decentralized platforms. These pools help exchanges like Uniswap work without relying on middlemen.
What is Buy Side Liquidity?
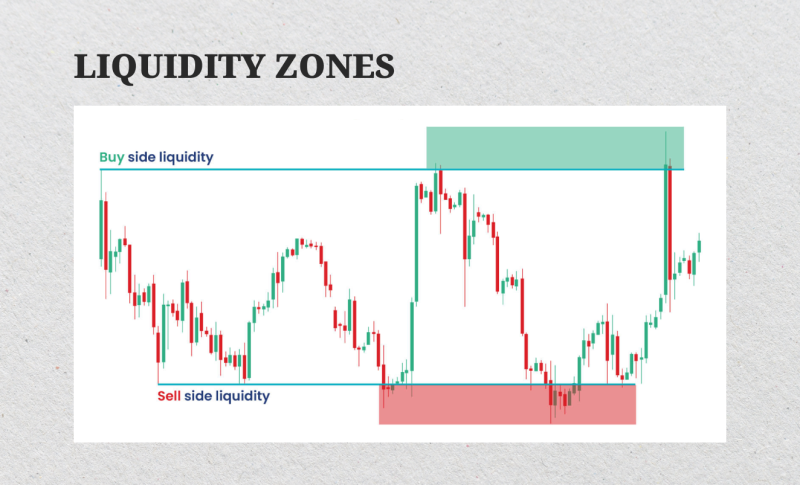
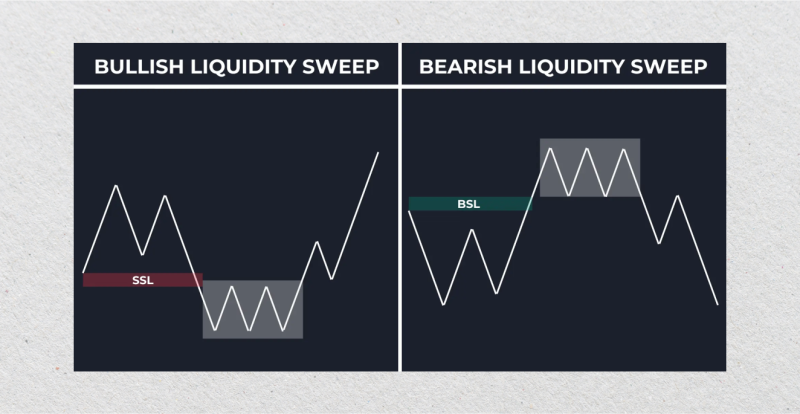
Buy side liquidity represents buy-stop orders placed above significant resistance levels. These orders create a liquidity pool that institutions target by driving prices upward to trigger them. Once the stops are hit, institutions may reverse the price, capturing liquidity from retail traders.
This process often creates what appears to be a strong upward breakout, which can mislead inexperienced traders into entering positions at unfavorable levels. Recognizing these false breakouts as liquidity traps is essential for aligning with institutional strategies.
Institutions exploit BBL not only for stop hunts but also to gather the volume needed to execute large sell orders without causing excessive market disruption. By targeting these pools, they create opportunities to rebalance their portfolios while minimizing risk.
What is Sell Side Liquidity?
Sell side liquidity consists of sell-stop orders below key support levels. Institutions exploit this liquidity by pushing prices downward to trigger these stops before reversing the trend.
Similar to buyside liquidity, sellside liquidity zones often attract sharp downward spikes in price that lure traders into selling prematurely. These sharp movements are frequently followed by a reversal that aligns with the institutions’ actual intent.
SSL also serves as a mechanism for institutions to accumulate long positions at discounted prices. By deliberately driving prices into these zones, they ensure sufficient liquidity for their trades and set the stage for upward price recovery.
Buy Side vs Sell Side
Here’s a comparison of two types of liquidity areas in the market:
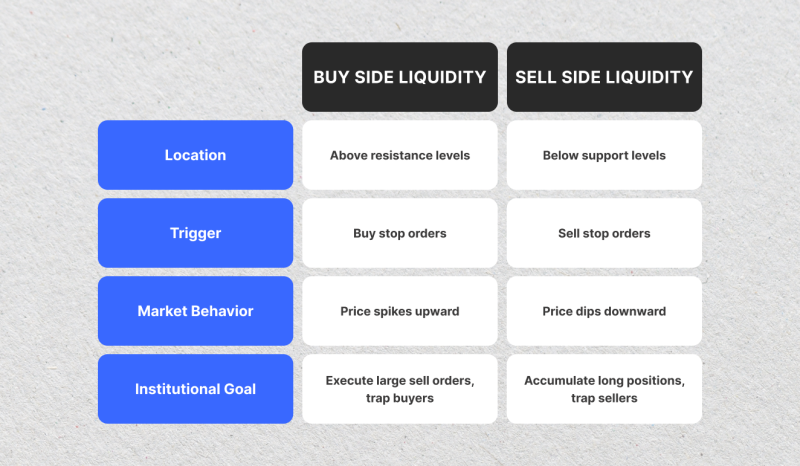
Retail traders often create these zones without realizing it, while big institutions take advantage of them. By spotting these areas, traders can follow the moves of larger players and avoid common mistakes.
How to Identify Liquidity Levels on Price Charts
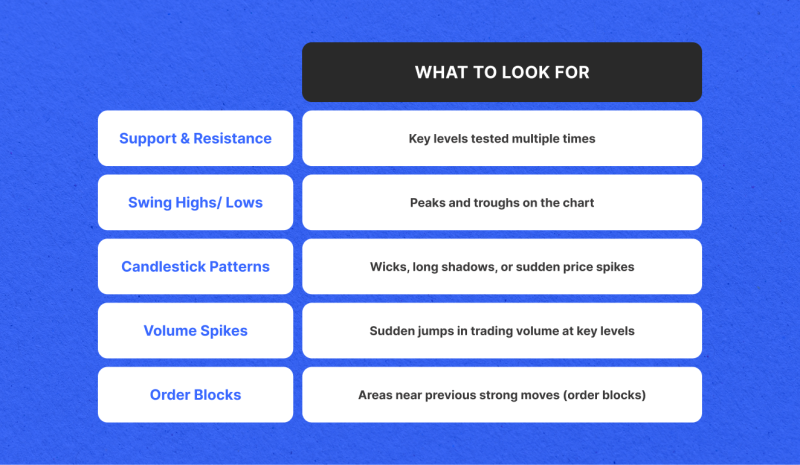
To trade successfully, it’s crucial to spot liquidity zones on price charts. Knowing where these zones are likely to form can help you predict price movements and avoid common mistakes. Here are some simple ways to identify them:
- Support and Resistance Levels: These are the most common areas where stop orders accumulate, acting as psychological and technical barriers. Repeated testing of these levels often strengthens the validity of liquidity pools.
- Swing Highs and Lows: Peaks and troughs on price charts often attract stop orders. These serve as magnets for institutional activity aiming to target stop-loss clusters.
- Candlestick Patterns: Wicks, long shadows, and sudden price spikes frequently signal stop hunts or false breakouts designed to trigger liquidity events.
- Volume Spikes: A sudden increase in volume at key levels can indicate institutional activity targeting liquidity zones.
- Order Block Proximity: Areas near previous order blocks, often highlighted in ICT methodology, can serve as high-probability liquidity zones.
Example in Action
Consider a market where the price repeatedly tests a resistance level over several trading sessions. Many retail traders tend to place buy stops just above this level, expecting a breakout.
When the price finally breaches the resistance, it’s often a liquidity sweep—a deliberate move to trigger these stops and create liquidity for institutional sell orders. Following the sweep, the price frequently reverses sharply, catching retail traders off guard.
After this sweep, the price often reverses quickly, catching retail traders by surprise. To confirm this, you might notice a candlestick with a long wick above the resistance and a spike in trading volume. These clues can help you anticipate the reversal and adjust your strategy accordingly.
How to Trade Liquidity Levels
Trading liquidity levels requires discipline, patience, and a clear strategy. To succeed, traders must learn to identify key areas of liquidity and anticipate the moves of institutional players. Here’s some tips:
1. Identify Liquidity Zones
Look for areas of accumulation above resistance (buy side) or below support (sell side). These are often marked by clusters of stop-loss orders, visible as swing highs and lows or near key technical levels like order blocks.
Pay attention to volume spikes or candlestick patterns that may indicate liquidity pools. Use technical tools such as Fibonacci retracements or moving averages to corroborate potential liquidity zones.
2. Anticipate Institutional Behavior
Use ICT’s concept of liquidity sweeps to predict where institutions may target. Institutions often create sharp price moves to exploit these zones and capture liquidity.
Watch for false breakouts, sudden price reversals, or large wicks on candlesticks, which signal institutional activity. Recognize inducements designed to lure retail traders into unprofitable positions before a reversal occurs.
3. Enter Trades Strategically
Wait for confirmation of a reversal after a liquidity sweep. Patience is key; entering too early can result in losses. Combine multiple signals—such as price action and volume—to strengthen your confidence in the trade setup.
4. Manage Risk Effectively
Managing risk is crucial to trading success. Place stop-losses beyond recent liquidity sweeps to avoid being stopped out during volatile moves.
Calculate position size according to your risk tolerance and the distance to your stop-loss level. Never risk more than a predetermined percentage of your account. As your trade progresses, reassess its risk-to-reward ratio to ensure it remains favorable.
5. Backtest and Refine Your Strategy
Finally, take the time to backtest and refine your strategy. Test your approach on historical price data to see how it performs under different market conditions.
Use demo accounts to practice execution and refine timing without financial risk. Keep a trading journal to track your performance, noting what works and what needs improvement. Regularly analyzing your journal will help you optimize your approach over time.

Effectively trading liquidity levels is as much about preparation and analysis as it is about execution. Following these steps and refining your skills can better align your strategy with institutional movements and improve your trading outcomes.
ICT: What Is This?
Michael J. Huddleston’s ICT methodology focuses on understanding how big institutions trade and use liquidity to move the market. This approach has changed how many traders view the markets, teaching them to look beyond simple price movements and understand the deeper mechanics of market manipulation.
ICT’s teachings empower traders to think like institutions rather than retail participants, significantly improving their ability to anticipate market behavior.
Core ICT Concepts
The ICT method introduces several key ideas for traders to comprehend how large market players leave clues in the market:
- Order Blocks: These are areas on the chart where institutions have placed large trades. They often signal where the market may reverse or continue moving, leaving a trail for observant traders to follow.
- Fair Value Gaps (FVGs): These are gaps created by sharp price movements that leave imbalances in the market. Prices often return to these areas, making them helpful in identifying potential trade setups.
- Equilibrium Levels: These are the midpoints of price ranges where the market often pauses or balances before making its next big move. Traders can use these levels to find areas of stability.
- Market Structure Shifts (MSS): These are breaks in key price levels that suggest a possible trend shift or continuation. Recognizing these shifts helps traders spot opportunities early.
- Liquidity Sweeps: Institutions often target areas with large numbers of stop-loss orders (liquidity pools). They trigger these orders, creating sharp price moves before continuing in their intended direction.
ICT provides traders with a toolbox that goes beyond traditional indicators.
Final Thoughts
Learning about BSL and SSL, along with ICT methods, gives traders a decisive edge in the markets. These concepts help traders better understand price action, shifting their approach from reacting to anticipating market movements.
Liquidity is the driving force behind every price move. By spotting key liquidity zones, understanding how institutions behave, and using tools like order blocks and fair value gaps, you can improve your decision-making and better understand how the market truly works.
FAQ
What is buy side liquidity in trading?
Buy side liquidity refers to areas where buy stops are concentrated, usually above resistance levels, and often targeted by institutional traders.
What is sell side liquidity, and how is it used?
Sell side liquidity consists of sell-stop orders below support levels. Institutions often push prices to these areas to capture liquidity before reversing the trend.
How do institutions manipulate liquidity?
Institutions often manipulate liquidity by targeting areas with significant stop-loss orders or pending orders to create artificial price moves. This allows them to accumulate or distribute positions at more favorable prices.


