Internal vs External Range Liquidity In ICT Trading Explained
July 04, 2025
Every trader at some point asks: Why did the price spike right before my stop-loss hit? Or why does it reverse just after breaking a major level? If you’ve been there, you’re not alone—and you’re closer to discovering the truth behind price action than you think.
In the ICT methodology, the answer lies in one word: liquidity. But not just any liquidity—we’re talking about smart money behavior. These are the hidden footprints of institutional players, and once you learn to spot them, you stop chasing price and start anticipating it.
Key Takeaways
- Internal range liquidity lies within a dealing range and is often the first target in a smart money setup.
- External range liquidity exists outside the market structure and signals major institutional intent.
- Trading both types of liquidity requires timing, confirmation, and understanding of fair value gaps and structure shifts.
What Is Liquidity in the ICT Context?
In the ICT (Inner Circle Trader) trading framework, liquidity isn’t just a market buzzword—it’s the lifeblood of price movement. While traditional definitions describe liquidity as the ease with which assets can be bought or sold, ICT takes it a step further.

It frames liquidity as a magnet for the price, an invisible force that guides the market structure and institutional behavior. In this context, liquidity isn’t passive—it’s actively hunted by smart money.
From an ICT point of view, liquidity pools represent clusters of stop-loss orders or pending orders that accumulate around key price levels—such as previous highs, lows, equal highs/lows, or areas of consolidation.
These are zones where retail traders unknowingly leave their “breadcrumbs” and where institutional players—often referred to as “smart money”—are likely to target for entries or exits.
In other words, liquidity is where the money is parked, and price tends to gravitate toward it to trigger those orders and create the fuel for large moves.

A significant aspect of the ICT methodology involves learning to read the market through the lens of liquidity rather than relying solely on indicators.
For example, when a price aggressively sweeps a recent low only to reverse and rally, ICT traders view this not as random volatility but as a calculated liquidity grab—a tactic to shake out weaker hands before the real move begins.
Fast Fact
Price doesn’t chase random levels—it seeks out where the money is parked. That’s why liquidity zones often predict the next market move better than any indicator.
What Is Internal Range Liquidity?
Internal range liquidity refers to the pools of buy and sell orders that accumulate within a clearly defined market range, typically between a recent bullish trend and a potential bearish reversal. It is like the “low-hanging fruit” sitting within the boundaries of a consolidation or sideways-moving market.
In ICT terms, this liquidity is what smart money often targets first—before making a move toward more significant price levels, such as external highs or lows.
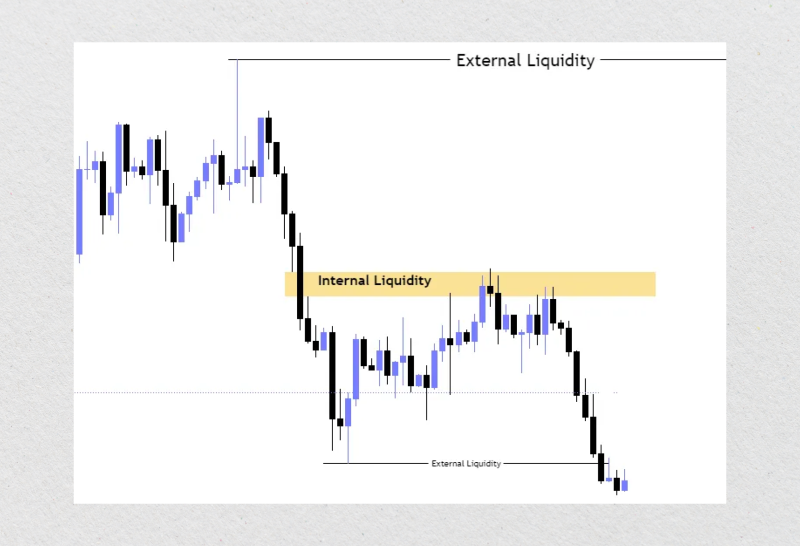
Within any trading range, especially on lower timeframes like the 5-minute or 15-minute charts, traders naturally leave behind stop-losses, pending orders, and unfinished business. These orders tend to cluster around minor swing points, equal highs and lows, or near short-term support and resistance levels.
This makes internal range liquidity a prime target for quick liquidity runs—short, calculated moves designed to sweep out weak hands and clear the path for the next major move.
For example, imagine the price is stuck in a tight range. Retail traders may go long from support or short from resistance, setting their stops just beyond those boundaries. What they don’t realize is that smart money is watching these levels—not to join the major trend but to exploit it.
A sudden spike into one side of the range (grabbing liquidity), followed by a reversal, is a classic ICT setup that revolves around internal liquidity being raided.
It’s also important to understand that internal range liquidity plays a key role in inducement—a concept in ICT that describes how retail traders are lured into premature positions.
Internal liquidity zones are often used as bait to create the illusion of a breakout, only for the price to snap back in the opposite direction. These sweeps are typically a precursor to something larger, such as a shift in market structure or a move toward an external liquidity target.
What Is External Range Liquidity?
External range liquidity refers to the clusters of stop orders and pending orders that lie outside a well-defined trading range—typically above the previous swing high or below the previous swing low.
In the ICT methodology, these zones represent the real prize for institutional traders. They’re where the largest concentrations of trapped liquidity are waiting—and where smart money often aims to move price next.
When the price consolidates for an extended period or follows a market direction, traders on both sides begin placing their stops just beyond obvious structure levels. Retail traders, for instance, might see a daily high and think, “That’s resistance—I’ll short here,” placing their stop just above the high.
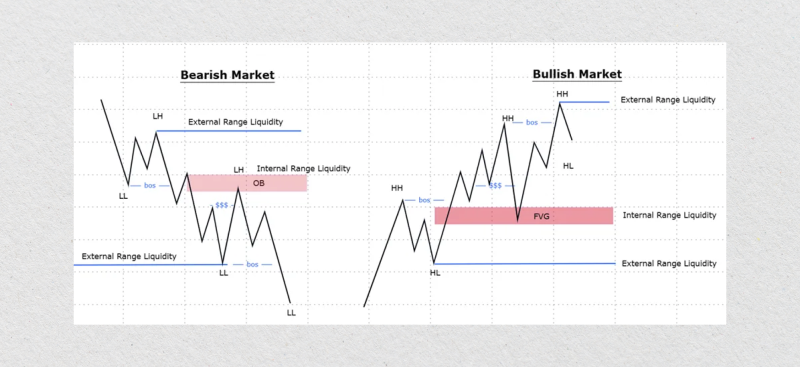
But from the ICT perspective, that area just above the swing high isn’t resistance—it’s a liquidity target. That’s where a significant pool of buy-side liquidity (mostly stop-losses and breakout entries) sits, waiting to be triggered.
Smart money uses this knowledge to its advantage. They’ll often engineer moves that first grab internal liquidity, creating false breakouts or sweeps within the range, before pushing price toward the external range to collect the real liquidity.
Once that external liquidity is cleared, you often see a decisive shift—either a reversal or a true breakout continuation, depending on the higher timeframe narrative.
What makes external liquidity so powerful is its connection to key institutional decision points. Price rarely hits these levels randomly. Instead, these zones are intentionally targeted to fill large orders that require both liquidity and momentum.
Key Differences Between Internal and External Range Liquidity
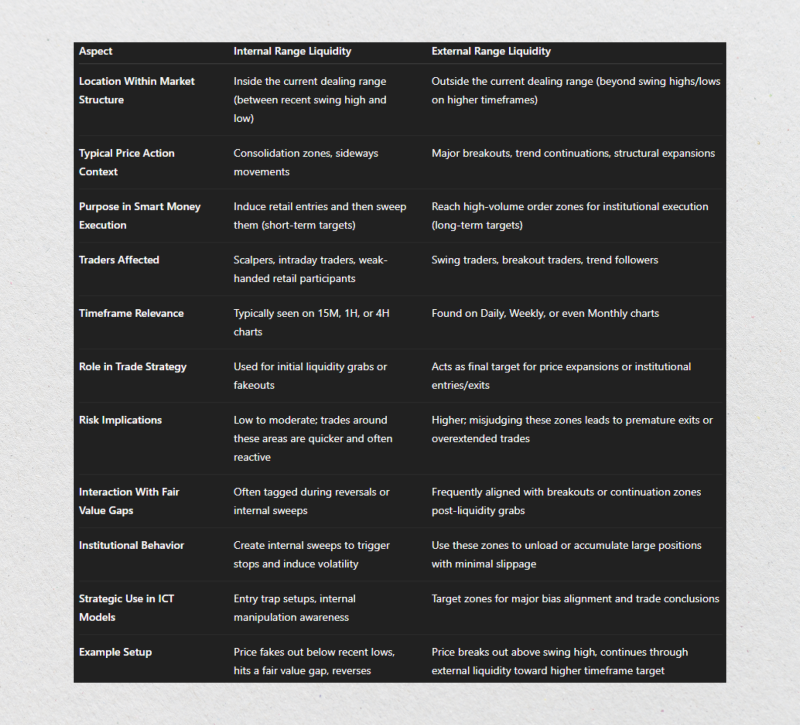
Understanding the key differences between internal and external range liquidity is fundamental to grasping what liquidity means in ICT trading. Both concepts revolve around how price interacts with hidden pools of orders, but they serve very different purposes in the broader structure of smart money price movement.
Location Within the Market Structure
Internal range liquidity exists within the current dealing range—that is, the space between a recent swing high and a swing low. It’s where stop-losses and pending orders accumulate during consolidation or sideways movement.
In contrast, external range liquidity lies beyond these boundaries. It’s typically found above major swing highs or below significant swing lows on higher timeframes, like daily or weekly charts.
While ICT internal range liquidity is often targeted for short-term liquidity sweeps, ICT external range liquidity acts as a more significant magnet, especially when institutions seek to move prices beyond structural boundaries to unlock larger pools of resting orders.
Purpose in Smart Money Execution
Smart money doesn’t just move prices randomly—it does so to reach liquidity. Internal liquidity is often the first stop: it’s where retail traders are induced into trades and then quickly shaken out.
Once this range of liquidity has been consumed, the price usually expands to target external liquidity, which includes the stops of swing traders, breakout traders, and trend followers.
Understanding what external liquidity is in trading means seeing these outer zones as destinations rather than obstacles. These are points where institutional traders can offload or enter large positions with minimal slippage due to the volume of orders present.
These zones are also where external liquidity providers, such as banks and prime brokers, may become more active, facilitating the execution of large block trades.
Timeframe Relevance and Risk Implications
Another key difference lies in the timeframe each type of liquidity is associated with. Internal range liquidity typically forms on intraday charts—15M, 1H, even 4H. Scalpers and day traders need to use a short-term trading strategy.
External range liquidity, however, is usually mapped on higher timeframes and carries a different level of external liquidity risk, especially during market volatility, news releases, or unexpected shifts in sentiment.
Misjudging this can lead to poor trade entries. For example, entering a short just because internal liquidity was swept—without realizing that external range liquidity lies just above—can result in a premature stop-out if the current market price continues its run to the higher timeframe target.
Role in Fair Value Gaps and Market Continuity
Both liquidity types often interact with fair value gaps, which are price imbalances that the market may seek to rebalance. Inside an ICT dealing range, the price often tags a fair value gap during a sweep of internal liquidity before reversing.
However, in external liquidity concepts, fair value gaps frequently align with breakout zones or key continuation levels—especially in a bullish market scenario, where price aggressively expands after taking out prior highs.
This interplay between liquidity zones and gaps helps traders anticipate not only where the price may go but how it might get there. It’s this combination of timing, structure, and liquidity awareness that defines a solid ICT-based trading strategy.
Strategic Application
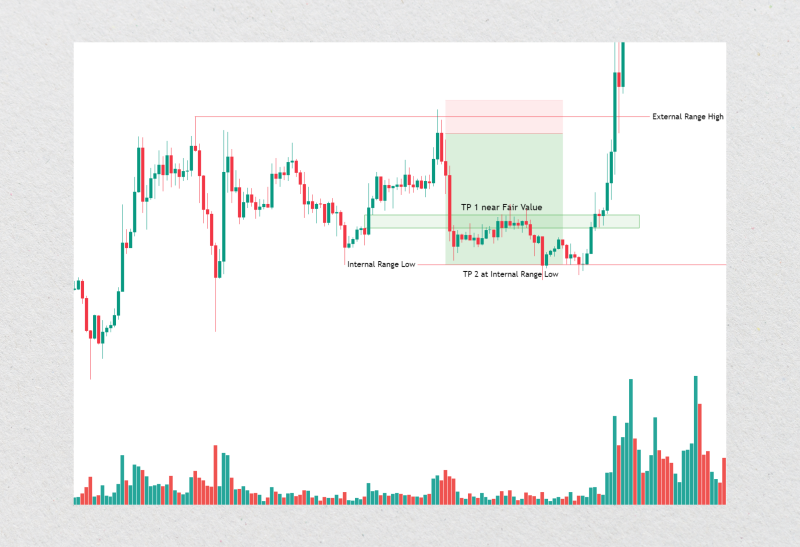
Successful ICT traders often structure trades in layers: first identifying where internal and external range liquidity sit, then building narratives around likely targets.
A typical play might involve price-sweeping internal range liquidity (grabbing short-term stops), tapping into a fair value gap, and then continuing toward external range liquidity, where the real market shift occurs.
The deeper your understanding of these range liquidity mechanics, the more accurate your bias becomes. Instead of reacting emotionally to price spikes, you begin to see them as intentional moves driven by institutional logic. You move from being hunted—to hunting with the smart money.
How to Identify and Trade Internal Liquidity?
Trading internal liquidity is about spotting where retail traders are most likely to get trapped—inside the dealing range—and aligning yourself with the moves of smart money. It may sound complex, but it ultimately boils down to price and market analysis using specific tools and confirming patterns.
Key Tools: FVGs, Order Blocks, Liquidity Voids
Use Fair Value Gaps (FVGs) to identify price imbalances within the range—common zones where prices often return to capture liquidity. Order blocks, which are the last bullish or bearish candles before a strong move, also serve as magnets when they line up with internal swing points.
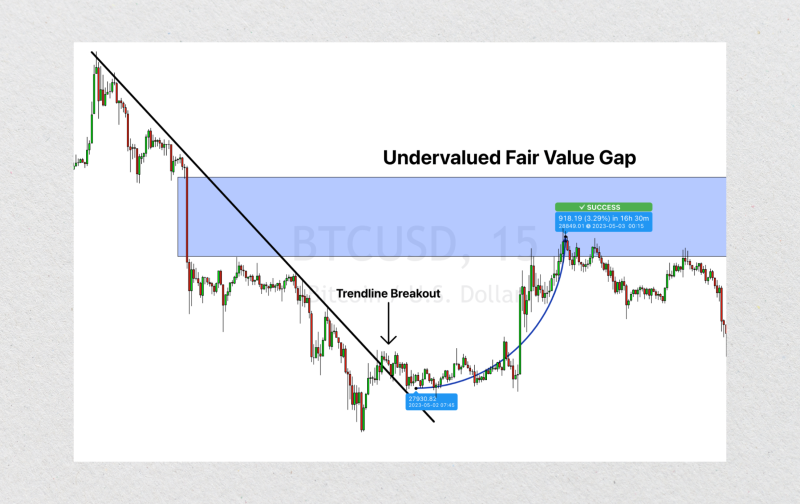
Watch for liquidity voids—areas of thin price action. These gaps are often rebalanced after internal sweeps, providing opportunities for smart entries.
Patterns: Equal Highs/Lows & Inducement Candles
Equal highs and lows attract stops—perfect traps. Retail traders think of a breakout, but savvy investors see an opportunity. Likewise, inducement candles signal that internal liquidity is being cleared before a reversal, baiting entries.
Entry Setup: Displacement and OTE
Look for a displacement candle—a strong move-breaking structure after a sweep. Then, use OTE (Optimal Trade Entry) with Fibonacci retracement (typically 61.8%–79%) to enter with tight risk, especially when aligned with FVGs or order blocks.

Risk Management
Keep stops tight—just beyond the sweep or invalidation zone. Risk 1–2% max per trade, and take partials as price moves across the range. Always be aware of external liquidity targets, even when trading internally.
How to Identify and Trade External Liquidity?
When trading external liquidity, you’re stepping into the zone where the bigger moves happen—those major runs that sweep out swing highs or lows on higher timeframes.
Unlike internal setups, which are more focused on intraday traps, external liquidity plays require a broader view and a deeper understanding of where smart money is ultimately headed.
Higher Timeframe Confluence: Weekly/Daily Swing Points
To identify potential external liquidity zones, start by zooming out. Focus on daily and weekly swing highs and lows, which often hold a large cluster of resting stop-losses from trend-followers and breakout traders. These levels aren’t just random lines—they’re magnets for liquidity, and smart money uses them to enter or exit large positions.
When price approaches one of these zones, it’s not just reacting to supply and demand—it’s hunting orders. If you want to trade like institutions do, you need to mark these key external points in advance and be patient as the price works its way toward them.
Anticipating Liquidity Runs: SMT Divergence & BOS/CHoCH Patterns
Before external liquidity is tapped, there are usually clues. SMT divergence (Smart Money Technique) is a powerful one. When two correlated assets exhibit price action moving in opposite directions—such as one reaching a new high while the other doesn’t—it often signals a trap and a potential reversal once liquidity is established.
Also, watch for BOS (Break of Structure) and CHoCH (Change of Character) patterns on lower timeframes. These patterns confirm a shift in control, often occurring after a liquidity grab. When a structure breaks near an external level, it’s a strong sign that the market is done running the stops and is ready to reverse or expand.
Entry Strategy: Post-Internal Sweep Confirmation
A common setup involves the price first clearing internal liquidity and then pushing into an external liquidity zone. Once there, look for signs of exhaustion—such as rejection candles, structure shifts, or SMT divergence. Enter only after confirmation—don’t try to front-run the sweep.
Combining internal and external liquidity logic improves your timing. Think of it like this: internal liquidity sets the trap, and external liquidity triggers the shift.
Trade Management: Partials & Break-Even on the Run-Up
External liquidity trades often cover a broader range, but that doesn’t mean they’re risk-free. Once you’re in, manage your position carefully. Take partial profits as the price moves in your favor, especially if it enters a previous dealing range or fills a fair value gap.
Always secure your trade by moving your stop to break even once the position is in clear profit. External moves can retrace sharply—especially after large stop hunts—so protect your gains while allowing the trade room to breathe.
Conclusion
In a world flooded with indicators, strategies, and noise, liquidity is the constant that drives every meaningful price move. It’s not enough to just know where the market has been—you need to understand why it went there. Internal and external liquidity aren’t abstract theories; they’re the invisible fuel powering the market engine.
Learning to identify internal range liquidity helps you avoid traps and time your entries with surgical precision. Recognizing external range liquidity, on the other hand, helps you spot where financial markets are ultimately headed—where the real money changes hands. Together, these tools offer a layered view of price action that transforms reactive trading into proactive decision-making.
FAQ
What is internal range liquidity in ICT?
It refers to the buy/sell orders within a swing high and low—typically swept first by smart money.
Why is external range liquidity important?
External liquidity zones contain large stop orders and are targeted for major institutional entries or exits.
How do I know when internal liquidity has been swept?
Look for displacement candles, structure breaks, or OTE entry zones right after a liquidity grab.
Should I use the same strategy for both liquidity types?
No. Internal setups are short-term and precise; external setups require a longer timeframe, confluence, and patience.


