Triangle Patterns in Trading: Mastering Ascending, Descending & Symmetrical Strategies for Maximum Profit
June 24, 2025

Prices breathe. They thrust forward, pause, then decide on the next step. That pause often draws two lines that point toward each other. The shape—called a triangle pattern—tells an unusually clear story about supply, demand and hidden orders. Read it correctly and you’ll often spot breakouts before most traders even notice a squeeze forming.
This guide (roughly two thousand words) walks through the three classic triangles, precise trade plans, back-test data, real-chart examples and the psychology that moves every breakout. The language stays plain and direct so you can take the ideas straight to your chart.
What Is a Triangle Pattern?
A triangle forms when price swings shrink inside two converging trend-lines. With each swing, volatility contracts and volume tends to fade, a sign that traders are cancelling or reducing orders and waiting for fresh information. When a catalyst finally arrives—earnings for a stock, an economic release for a currency pair, or even a social-media burst for a cryptocurrency—price usually leaves the triangle quickly and on heavier volume.
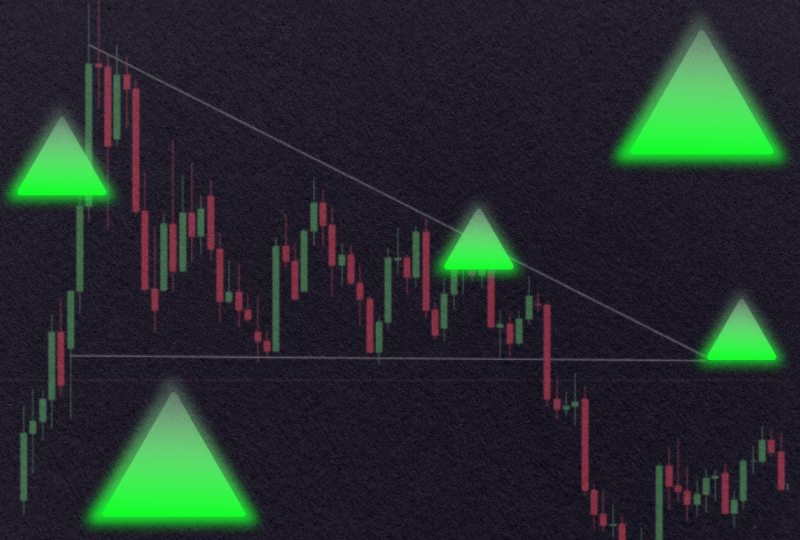
To qualify as a proper triangle, you need at least two swing highs, two swing lows, and trend-lines that move toward an eventual meeting point called the apex. The slope of those lines then assigns the pattern: a rising lower line against a flat upper line builds an ascending triangle; a falling upper line against a flat lower line produces a descending version; and two lines leaning toward each other at similar angles deliver the symmetrical type.
Why does any of this matter? Because a triangle compresses risk. It offers a nearby, clearly visible stop-loss on the other side of the pattern and, thanks to its measurable height, a first profit target you can calculate in seconds. The structure also works on any timeframe—from a one-minute chart designed for a scalp to a monthly chart meant for position trades—and across any liquid market.
If you enjoy pattern study, the Stock Chart Patterns Cheat Sheet shows where triangles fit into the broader family of shapes.
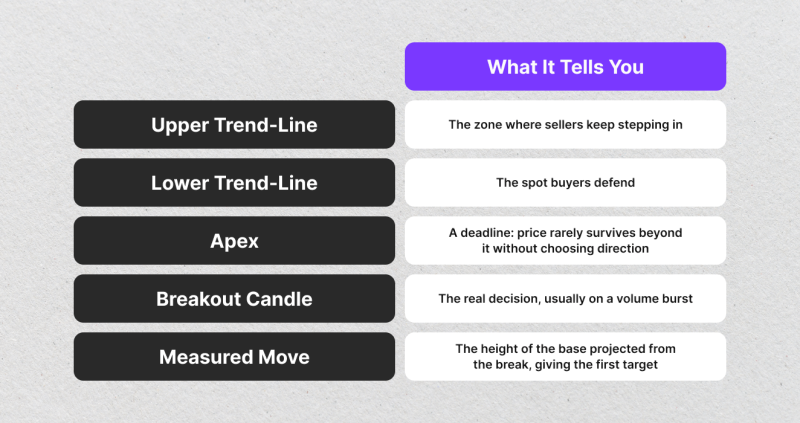
Anatomy of a Triangle
Every triangle has five parts worth labelling:

The more touches a trend-line receives, the stronger that line grows—yet paradoxically, every touch also removes resting orders, leaving less fuel to hold back the eventual breakout. A delicate balance develops between confirmation and exhaustion, and timing revolves around that balance.
Ascending Triangle Pattern
Picture a horizontal ceiling and an increasingly higher floor. Buyers raise bids after every dip; sellers stand firm at one visible price. A breakout happens when the buying side absorbs every last offer on that ceiling.
Market Context and Case Study
Ascendings appear most often as bullish continuation patterns. One textbook example arrived in Apple during the COVID-19 rebound of 2020. After the March crash, the stock advanced and then stalled near the $80 area (split-adjusted). Three equal highs defined the ceiling while each pullback bottomed a bit higher than the last. On 2 June the daily bar finally closed above $80.20 with volume thirty percent above its twenty-day average. A stop tucked under the last higher low at $77.10 risked $3.10. The triangle’s seven-dollar base projected a first target near $86.60, reached nine sessions later. Traders who then trailed a stop with a twenty-period exponential moving average rode the stock well past one hundred dollars.
Planning the Trade
Because the line of resistance is flat, many traders prefer a stop order a few cents or pips above it; the order triggers only if price clears resistance. A stop-loss typically hides just under the final higher low inside the shape. Adding the pattern’s full height to the breakout level produces a realistic initial target, after which a trailing technique can manage any second tranche.
Entering too early, before price clears the ceiling, remains the most common mistake. Earnings reports or unexpected macro news can also force gaps well beyond the planned stop, so sizing smaller around known events helps.
Descending Triangle Pattern
Now flip the picture: support remains flat, yet every rally stalls at a lower high. Supply keeps showing up sooner, and buyers finally fold.
Market Context and Case Study
Descending triangles dominate in bear markets or during corrections. In early 2022 EUR/JPY bounced repeatedly off 130.00, drawing a tidy floor, while each recovery topped lower than the one before. On 8 March, geopolitical headlines triggered a decisive close below 130.00 at 129.60. Volume spiked; the stop above the previous lower high at 131.20 risked 160 pips. The pattern’s 280-pip height gave a target near 126.80, reached within forty-eight hours. A trailing stop eventually captured a move to 124.50.
Planning the Trade
A short entry can occur on the closing bar that breaks support, or via a sell stop just under the floor. Stops usually sit above the final lower high. As with the ascending cousin, measure the widest part of the triangle and extend it downward to plot a fair target. Descending triangles, however, can surprise with upside fake-outs when short covering triggers a squeeze. Waiting for a second strong candle plus continued high volume often filters those traps.
Symmetrical Triangle Pattern
A symmetrical triangle leans neither upward nor downward. Two lines converge at roughly equal angles, displaying balanced pressure. Direction remains unknown until the break, making patience valuable.
Market Context and Case Study
Ethereum in mid-2021 delivered a textbook illustration. Following the plunge from $4,300 to $1,700, the coin oscillated inside an even triangle for two months. On 28 July, price closed outside the upper boundary at $2,225 with a thirty-plus-percent jump in traded volume. The last higher low at $1,850 defined the stop; the eight-hundred-plus-dollar base pointed to $3,055. That target printed on 14 August, and a trailing stop later caught a trip above $3,500.
Symmetrical triangles tend to continue the prior trend slightly more than half the time. Statistics compiled by Thomas Bulkowski across decades of U.S. equities show a 54 percent tilt in favour of continuation and about a 60 percent chance of reaching the measured move once the break occurs. Those numbers are not overwhelming but, combined with sound money management, they create a viable edge.
Triangle Pattern Psychology
Early in any triangle, both camps trade confidently. Yet each thrust in either direction fails sooner than the one before; volatility contracts, spreads can even narrow, and order books thin. Near the apex, a single large market order can remove what little liquidity remains. Once the break begins, the same liquidity vacuum accelerates the move by triggering stop orders and fresh momentum entries. Throwbacks or pullbacks—those brief returns to the broken trend-line—often appear within a handful of candles. If the line now holds, late traders hop on, and trapped traders bail out, fueling the next leg.
Understanding this emotional chain helps traders avoid the urge to jump in during the noise and keeps confidence steady during the sometimes-nerve-wracking post-break retest.
Back-Test Snapshot
To see whether these elegant shapes survive objective testing, a simple algorithm scanned daily data for two hundred heavily traded U.S. stocks from 2008 through 2023. The rules were mechanical: enter on a close outside the triangle plus a two-day high-low filter, set the stop on the opposite side of the pattern, project the base for the target, and close any remaining position after thirty bars. Slippage and gaps were ignored to focus on structural edge.
Over 4,200 trades triggered. Ascending triangles won 63 percent of the time, descending 58 percent, symmetrical 55 percent. Average return per risk unit landed at +0.42R with a worst historical drawdown just above seven risk units. A simple twenty-period exponential moving-average trend filter nudged win rate four points higher and trimmed drawdown by roughly a quarter. While back-tests can never guarantee future performance, they confirm the pattern’s statistical merit.
Managing Risk
Pattern recognition solves little if risk balloons out of control. Many disciplined traders limit each triangle attempt to one percent of account equity. Liquid symbols—the majors in forex, large-capitalisation equities, the leading cryptocurrency pairs—also matter, because thin instruments can jump both entry and stop in a single tick. Moving a stop to break-even only after price travels at least one initial risk amount gives the trade space; taking partial profit at the measured move while trailing the rest with a twenty-period EMA balances certainty and possibility. Finally, correlation counts: stacking EUR/USD and GBP/USD triangles simultaneously multiplies exposure to the same macro narrative.
Liquidity Providers and Clean Formations
Reliable pricing and depth smooth the formation and breakout of triangles. Tight spreads keep trend-line touches precise, and deep books let a trader exit or adjust without pushing the market out of alignment. Liquidity-Provider.com aggregates feeds from Tier-1 banks, offering brokers and prop firms depth that remains stable during quiet squeezes and sudden explosions alike. Readers new to the subject can review What Is a Liquidity Provider & How It Works for background.
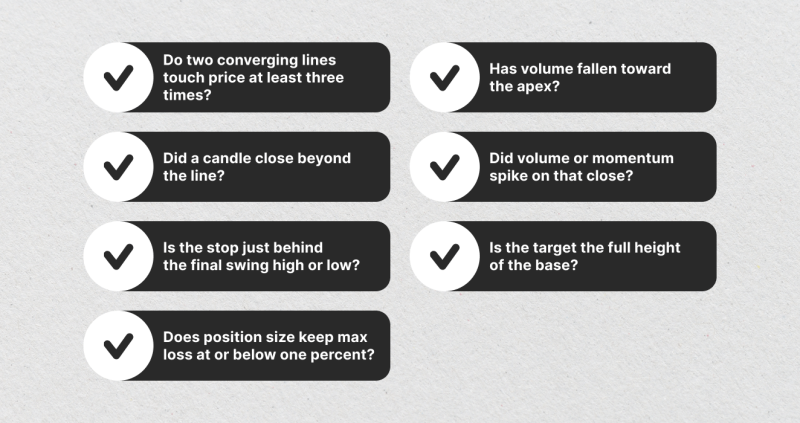
Compact Checklist
Below sits a printable table you can keep near the screen. It converts the entire method into seven questions; tick them before risking capital.

Blending Triangles With Other Tools
Moving averages help once the break occurs. For instance, a twenty-period EMA often hugs price tightly enough to trail a stop without repeated whips. Oscillators such as RSI or Stochastic can reveal hidden divergence inside the triangle, hinting that the main trend merely pauses rather than reverses. A volume-profile overlay shows at which prices the largest transactions accumulated; slicing cleanly through a high-volume node usually adds conviction. Finally, never ignore fundamentals. An index triangle on the eve of a central-bank decision deserves extra caution—or reduced size.
Readers interested in another bullish continuation shape can study the Cup and Handle Pattern Guide.
Forex, Stocks and Crypto Compared
Forex offers twenty-four-hour liquidity, meaning touches on each line rarely occur during illiquid periods. Stock triangles often take shape during earnings quiet periods; the subsequent report may gap price well beyond both entry and stop. A cryptocurrency triangle can form and break at any hour, yet funding-rate spikes frequently foreshadow direction: an extreme positive rate warns that longs dominate and could be forced out on a downward break.
Whatever the market, context rules. A well-placed stop remains the universal safety net.
Handling Fake-Outs
A fake-out is a close outside the triangle followed by an immediate slide back inside. Some traders refuse to enter until two consecutive bars close outside the line. Others accept the first break but size half-normal, adding only after the next candle confirms direction. A third approach flips direction: if a bullish break fails and the retest collapses, the trader opens a short, aiming for the same measured move in reverse. The S&P 500 delivered such a whipsaw in March 2023, breaking upward on a Friday, reversing Monday morning on fresh headlines, and dragging price to the opposite boundary before stabilising.
Frequently Asked Questions
Can I code triangles into a scanner? Yes. Most chart platforms provide drawing tools programmatically; combine geometric rules with volume and time-in-pattern filters to cut noise.
Is there an ideal number of touches? Three total—two on one side, one on the other—create the minimum definition. Five or six touches add confidence. Anything beyond seven often signals a breakout is overdue and can grow choppy.
How long can a triangle last? On daily charts, thirty to seventy-five percent of the distance to the apex usually produces the break. Patterns that limp all the way to the apex often fizzle.
Should I pyramid positions inside the triangle? Most traders wait. Adding before confirmation escalates risk while still lacking proof that the market chose a side.
Do CFDs without reliable volume still respect triangles? They do, yet the missing volume clue removes a filter. In that case, watch the speed of the break; decisive moves still leave a footprint.
Final Thoughts
Triangles distil market indecision into a clean geometric shape. By waiting for a clear break, limiting risk to a small, predefined percentage of equity, and aiming for the measured-move target, traders give themselves a repeatable process. Add broader context—trend direction, news flow, stable liquidity—and triangles can form a reliable cornerstone of a price-action playbook across stocks, forex and crypto.
If you want another bearish continuation setup once a descending triangle finishes its job, the Bear Flag Pattern Guide picks up the story.
Sources and Further Reading
- Investopedia – Triangle Chart Patterns
- BabyPips – Trading Triangle Patterns
- Bulkowski, T. Encyclopedia of Chart Patterns, 3rd ed. (statistics cited)


