What is Fibonacci Retracement, and How to Use it in Trading?
Dec 26, 2024

Technical analysis has become a cornerstone of trading strategies in today’s capital markets. This approach offers a detailed perspective on market sentiment. It helps identify recurring patterns in price movements and illuminates changes in absolute and relative indicators across different time frames for each asset.
Fibonacci retracement levels are frequently utilized to discern short- and long-term trends in price trajectories and evaluate corrections and correlations with other price metrics. These levels act as a reference point for forecasting potential scenarios in trend continuation or reversals, providing traders with a structured framework for analyzing market dynamics.
This article will help you understand what the Fibonacci sequence is, what advantages and disadvantages it has, and how it is used in bullish and bearish trends. You will also learn about the future of this indicator and what improvements are in store for it.
Key Takeaways
- Fibonacci levels align with natural profit-taking and risk-management points, often driving significant price reactions.
- These retracement levels are applicable across all time frames, making them suitable for short- and long-term traders.
- Pairing Fibonacci retracement with indicators like RSI, moving averages, and MACD enhances its reliability.
What is the Fibonacci Retracement Indicator?
Fibonacci retracement is a widely used technical analysis tool that helps traders pin down potential support and resistance levels in an asset’s price movement. It is based on the Fibonacci sequence, a mathematical series where each number is the sum of the two preceding ones.
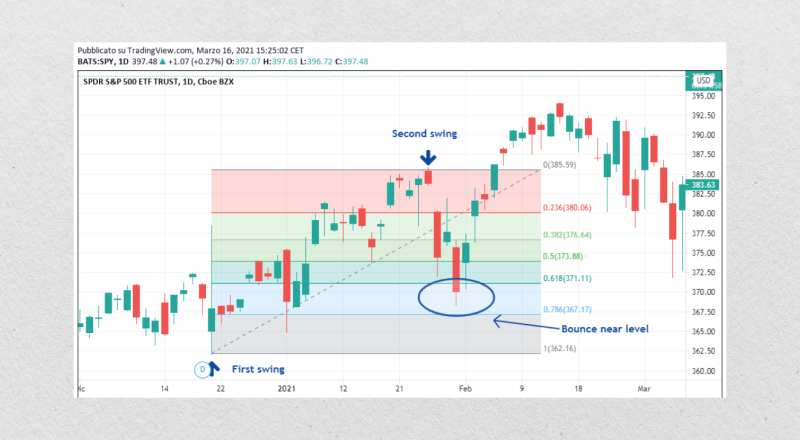
Such a sequence forms the foundation for calculating key retracement levels, including 23.6%, 38.2%, 50%, 61.8%, and 78.6%. These levels represent points where a price correction or pullback might reverse and continue in the direction of the prevailing trend.
The concept of Fibonacci retracement is rooted in the idea that markets move in waves rather than straight lines. After a significant upward or downward price movement, it is natural for the market to retrace or pull back before resuming its primary trend.
Fibonacci retracement levels provide traders with a framework for predicting these potential reversal points, enabling them to make informed decisions about entry, exit, and risk management.
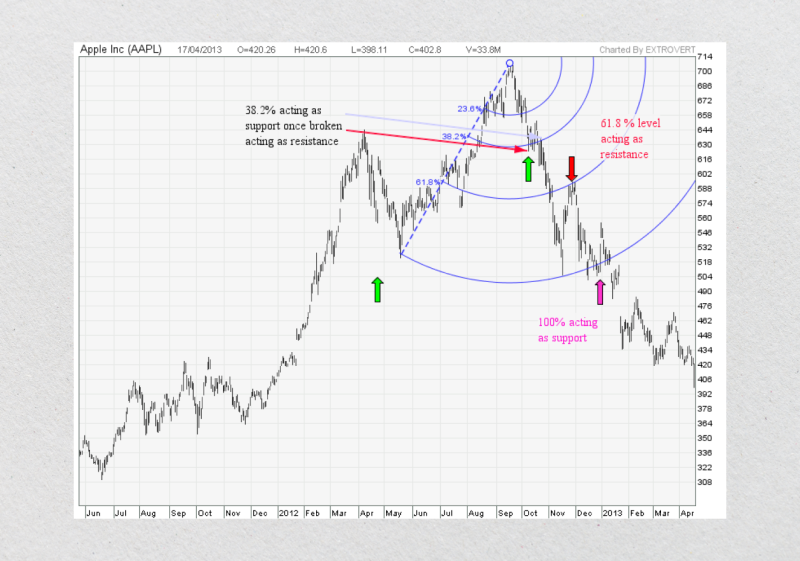
Applying Fibonacci retracement to a price chart involves selecting two key points: a swing high (the peak of a price move) and a swing low (the bottom of a price move).
The retracement tool plots horizontal lines at the Fibonacci levels between these two points. For example, if an asset’s price rises from $100 to $200, the 38.2% retracement level would be at $161.80, providing a potential support level during a pullback.
The sequence we now recognize as the Fibonacci sequence has been utilized by practitioners across diverse fields, including scientists, musicians, and civilizations such as the Greeks, Sumerians, and Egyptians.
Over centuries, this sequence has been instrumental in developing insights and expectations Interestingly, the term “Fibonacci Sequence” was introduced by the French-born mathematician Édouard Lucas (1842–1891).
In his book Liber Abaci, Leonardo Fibonacci laid out methods and rules for calculations using the Hindu-Arabic decimal positional system with Arabic numerals. Among the concepts presented was an intriguing experiment described by Douglas (2001):
“A man places a pair of rabbits in an enclosed area surrounded by walls. How many pairs of rabbits can be produced from this pair in one year, assuming that each month, every pair produces a new pair that becomes reproductive starting from the second month?”
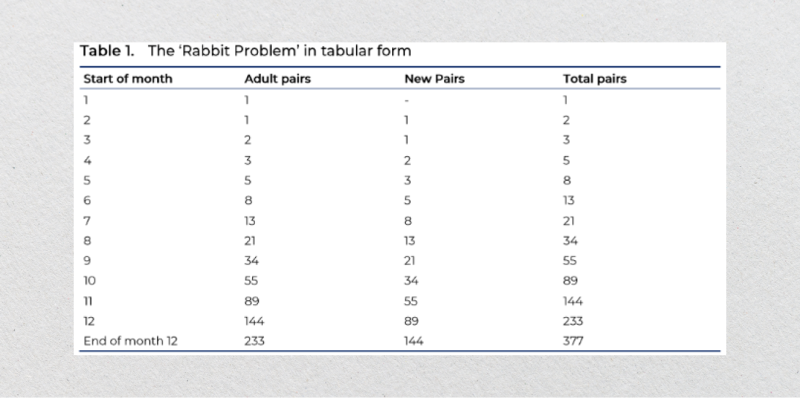
This hypothetical scenario demonstrates the sequential growth pattern that Fibonacci illustrated. For clarity, Tables 1 and 2 further detail this pattern.

Fast Fact
Indian mathematicians introduced Fibonacci numbers and sequencing centuries before Leonardo Fibonacci popularised them.
Fibonacci Retracement in Bullish and Bearish Trends
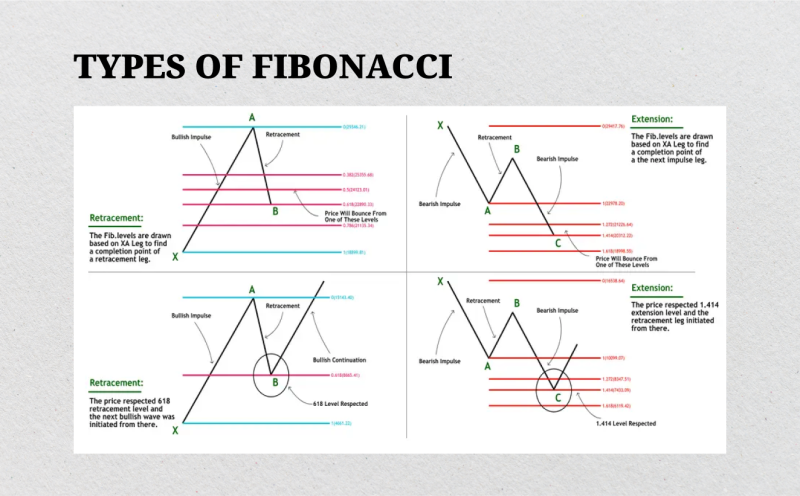
Fibonacci retracement is a versatile tool that works effectively in bullish and bearish trends, helping traders identify potential reversal or continuation points. Whether the market is rising or falling, Fibonacci levels provide a framework for understanding price corrections and deciding the best points for entering or exiting trades.
In Bullish Trends
In a bullish trend, the price generally moves upward in a series of higher highs and higher lows. During this upward movement, the market often experiences short-term pullbacks or corrections as traders take profits or as momentum temporarily slows. These pullbacks are natural parts of the trend and usually allow traders to enter the market at more favorable prices.
Using Fibonacci retracement in a bullish trend involves identifying the swing low (the starting point of the upward move) and the high (the highest point before the pullback). Fibonacci levels are then plotted between these two points, creating potential support levels where the price might reverse and resume its upward trajectory.
For example, consider a stock that rises from $50 to $100. After reaching $100, the price begins to pull back. By applying Fibonacci retracement, traders can identify levels such as 23.6%, 38.2%, and 61.8% of the $50 move, providing support levels at approximately $88.20, $76.40, and $61.80. If the price consolidates or shows signs of reversal at one of these levels, traders may use it as a signal to enter a long position.
Key indicators, such as volume spikes or bullish candlestick patterns (e.g., hammers or engulfing patterns), can confirm the likelihood of the trend resuming at these levels. A bounce at the 38.2% or 61.8% level often signals strong bullish momentum, indicating the trend is likely to continue.
In Bearish Trends
In a bearish trend, the price moves downward in a series of lower and lower highs. As in bullish trends, price movements in bearish trends are rarely linear, and the market often experiences temporary rallies or recoveries before resuming the downtrend.
These upward retracements can be analyzed using Fibonacci levels to identify potential resistance points where the price might reverse and continue downward.
To apply Fibonacci retracement in a bearish trend, traders identify the swing high (the starting point of the downward move) and the swing low (the lowest point before the retracement). Fibonacci levels are then drawn between these two points, providing potential resistance levels where the price might encounter selling pressure.
For instance, if a cryptocurrency drops from $1,000 to $500, Fibonacci retracement levels such as 23.6%, 38.2%, and 61.8% can help traders locate resistance levels at approximately $618, $764, and $882. If the price struggles to move above one of these levels and starts to decline, traders may use it as a signal to enter a short position.
In bearish trends, confirmation tools such as bearish candlestick patterns (e.g., shooting stars or bearish engulfing patterns) or momentum indicators like RSI (showing overbought conditions) can help validate resistance at Fibonacci levels. A 50% or 61.8% reversal often signals that the bearish trend is likely to resume with strong selling momentum.
Fibonacci Retracement: Strengths and Limitations
Fibonacci retracement is a widely used tool in technical analysis. It enables traders to distinguish potential support and resistance levels based on the Fibonacci sequence. While it is highly effective when used correctly, it has strengths and limitations, which traders must grapple with to leverage it optimally.
Strengths of Fibonacci Retracement
To begin with, let’s consider a number of positive qualities that distinguish this indicator from others in terms of application in technical analysis. These include the following:
Broad Applicability Across Financial Markets
Fibonacci retracement demonstrates remarkable flexibility. It functions effectively across diverse asset classes, such as equities, foreign exchange, commodities, and digital currencies. Its adaptability makes it indispensable for market participants trading across multiple time horizons, from intraday scalping to strategic long-term investments.
Precision in Identifying Crucial Price sones
The Fibonacci retracement levels (23.6%, 38.2%, 50%, 61.8%, and 78.6%) are precise markers for forecasting potential inflection points. These levels highlight areas where price retracements may decelerate, reverse, or consolidate, reflecting market participants’ psychological thresholds and natural profit-taking behavior.
Synergy with Complementary Analytical Tools
Fibonacci retracement harmonizes seamlessly with other technical instruments, including exponential moving averages, relative strength index (RSI), moving average convergence divergence (MACD), and diagonal trendlines. When these metrics converge with Fibonacci levels, the alignment offers enhanced conviction in identifying actionable trade setups.
Efficacy in Directional Market Trends
In established bullish or bearish trends, Fibonacci retracement excels by delineating potential pullback sones where momentum might rebound. This capability aids traders in optimizing entries aligned with prevailing market sentiment, making it a favored tool for trend-following methodologies.
Enhanced Risk-Reward Structuring
By delineating anticipated support or resistance zones, Fibonacci retracement allows traders to calibrate entry, exit, and stop-loss parameters with precision. This nuanced approach to risk management helps optimize reward potential while minimizing downside exposure.
Limitations of Fibonacci Retracement
Now, let’s consider the opposing sides, i.e., the disadvantages inherent in this indicator within the trading practice. Among them, we can highlight the following:
Ambiguity in Swing Highs and Lows
The reliability of Fibonacci retracement hinges on accurately pinpointing pivotal price extremes (swing highs and lows). Traders’ interpretation discrepancies often lead to divergent projections, introducing subjectivity into the method’s application.
Dependence on Corroborative Indicators
Fibonacci retracement functions as a supplementary rather than a standalone metric. Its efficacy improves significantly when corroborated by additional analytical tools that validate price behavior, such as volume analysis or trendline confluences. Without such confirmations, the risk of erroneous forecasts increases.
Reduced Reliability in Non-Trending Markets
Fibonacci retracement levels often lose predictive power in horizontal or range-bound market environments. The absence of directional momentum diminishes their relevance, leading to unreliable support and resistance level delineation.
No Guarantee of Price Reaction
While Fibonacci retracement levels frequently align with price pivots, they are not infallible predictors. Prices can breach these levels, rendering the analysis invalid. Traders must remain vigilant and responsive to evolving price action dynamics.
Potential for Overreliance and Market Saturation
The widespread adoption of Fibonacci retracement can sometimes lead to excessive clustering around key levels, triggering self-fulfilling prophecies or creating false breakouts. This saturation effect may distort market behavior, especially in highly liquid assets.
Inattention to Fundamental Catalysts
Fibonacci retracement is purely a technical construct and inherently excludes macroeconomic variables such as earnings releases, central bank policies, or geopolitical developments. Such fundamental drivers can abruptly override technical patterns, rendering Fibonacci levels ineffective in isolation.
Future Developments and Applications of Fibonacci Retracement
The Fibonacci indicator, which uses mathematical models, is one of the most effective indicators in the world of trading markets and investment activity. As a consequence, it is also one of the most studied objects. Its future applications can be much broader and more diverse than simply predicting price movements.
Here are some of the expected areas of practical application and development of the Fibonacci indicator in the future:
Integration with Advanced Algorithmic Trading
As financial markets evolve, Fibonacci retracement is increasingly integrated into algorithmic and quantitative trading strategies. By embedding Fibonacci levels into trading bots and automated systems, traders can execute precise entries and exits based on predefined retracement thresholds.
This automation reduces human error and allows for rapid decision-making, particularly in fast-moving markets like cryptocurrencies or Forex.
Enhanced AI and Machine Learning Applications
The adoption of artificial intelligence (AI) and machine learning is poised to revolutionize the use of Fibonacci retracement. Machine learning models can analyze vast datasets to identify the most effective Fibonacci levels for specific market conditions and asset classes. Additionally, AI can dynamically adjust real-time retracement calculations, accounting for evolving volatility and market sentiment.
Fusion with Multi-Timeframe Analysis
Future applications of Fibonacci retracement will likely emphasize its use across multiple timeframes. By incorporating Fibonacci levels from intraday, daily, and weekly charts, traders can identify confluence sones that enhance the predictive power of retracement levels. This multi-timeframe approach offers a more holistic view of market trends and reversals.
Customizable Fibonacci Levels for Asset-Specific Analysis
While traditional Fibonacci retracement levels are universally applied, there is growing interest in customizing these levels based on the characteristics of specific assets or markets. For instance, markets with higher volatility may benefit from adding intermediary levels, allowing for more nuanced analysis.
Integration with Blockchain and Decentralised Finance
The rapid growth of blockchain and DeFi ecosystems presents new opportunities for Fibonacci retracement. DeFi platforms could integrate Fibonacci tools into decentralized trading interfaces, enabling traders to apply these techniques directly within smart contracts. This could democratize access to advanced technical analysis for a broader range of participants.
Fibonacci in Behavioural Finance
As the psychological underpinnings of market behavior gain recognition, Fibonacci retracement could play a more prominent role in behavioral finance. Its levels often align with natural human tendencies, such as fear and greed, offering insights into crowd behavior. Future research may further explore the connection between Fibonacci ratios and investor psychology.
Enhanced Visualisation and Analytical Tools
With advancements in charting software and trading platforms, Fibonacci retracement tools are becoming increasingly sophisticated. Future developments may include interactive 3D visualizations, augmented reality (AR) overlays, and real-time dynamic adjustments to Fibonacci levels based on live market conditions.
Application in Emerging Markets
Fibonacci retracement has traditionally been applied in developed markets, but its utility in emerging markets is gaining traction. These markets often exhibit unique volatility patterns, making Fibonacci levels a valuable tool for navigating less predictable price movements.
Use in Risk Mitigation Strategies
As risk management continues to be a priority for traders and investors, Fibonacci retracement could play a greater role in hedging strategies. By identifying key retracement levels, traders can set more accurate stop-loss orders and design hedges that protect against adverse price movements.
Educational and Training Enhancements
Better education and training are also key to the future of Fibonacci retracement. Trading platforms and institutions will likely offer more detailed tutorials, webinars, and AI-driven learning modules to help traders master Fibonacci techniques and integrate them into their strategies.
Conclusion
Fibonacci retracement is a powerful tool in a trader’s arsenal. It offers valuable insights into potential support and resistance levels. Its strengths lie in its adaptability across markets, ability to improve risk management, and usefulness in trending environments.
However, its limitations, such as subjectivity, reliance on complementary tools, and vulnerability to fundamental disruptions, mean it should be used judiciously.
Combining Fibonacci retracement with other technical and fundamental analysis methods can help traders make deliberate decisions while minimizing risks.
FAQ
What is Fibonacci retracement in trading?
Fibonacci retracement is a tool used to evaluate potential support and resistance levels based on ratios derived from the Fibonacci sequence.
Why is the 61.8% level significant?
The 61.8% level, or “Golden Ratio,” is a key retracement level where prices often react strongly, either reversing or continuing the trend.
Can Fibonacci retracement work in all markets?
Fibonacci retracement is most effective in trending markets, where price corrections often respect these levels.
Is Fibonacci retracement a guaranteed strategy?
No single strategy, including Fibonacci retracement, guarantees success. Combining it with other indicators and risk management improves reliability.


