Head and Shoulders Pattern: What is it, and How to Master it
Oct 11, 2024
Trading in the capital markets is a complex process that involves taking into account many variables, accurate analysis of market trends, a sound strategy, and a deep understanding of the functioning of market laws based on the interpretation of various formations and patterns, the role of which is to inform about possible changes in the mood of market participants and as a consequence, changes in market movements. One such formation is head and shoulders, often encountered in trading practice.
This article will tell you what head and shoulders patterns are, what types there are, and what you should consider when trading with them.
Key Takeaways
- The head and shoulders pattern is a technical indicator featuring three peaks, with the outer two being similar in height and the middle peak being the highest.
- This pattern is regarded as one of the most reliable signals for predicting trend reversals, indicating a shift from bullish to bearish.
- The inverse head and shoulders pattern signals a reversal from bearish to bullish.
What is the Head and Shoulders Figure?
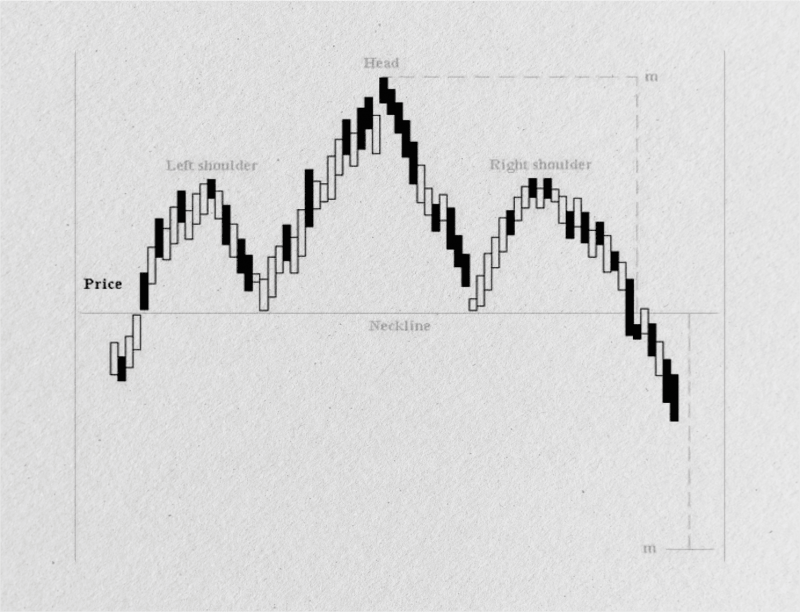
The head and shoulders pattern is a well-known chart formation employed in technical analysis to signal potential market reversals. It consists of three distinct peaks resembling a head silhouette between two shoulders, hence the name. The pattern indicates a trend is likely to reverse its direction, either from bullish to bearish or bearish to bullish.
The head and shoulders trading pattern is popular due to its reliability in forecasting significant shifts in market trends. When traders identify this formation, it suggests that the existing trend has lost momentum, and a reversal could be imminent.
In the case of a bullish market, where prices have been rising, a standard head and shoulders pattern indicates that sellers are gaining control, potentially driving the price downward. Conversely, in a bearish market, an inverse head and shoulders pattern suggests that buyers may be stepping in, potentially pushing prices higher.
A key characteristic of the head and shoulders pattern is its symmetry. In an ideal scenario, both shoulders (the left and right) are roughly equal in height and width.
However, in reality, variations in symmetry are expected, with one shoulder sometimes being slightly taller or wider than the other. Although symmetry helps identify a clean pattern, it is not always required to be valid. Traders must account for such variations while analyzing the pattern to avoid missing key trading opportunities.
The head and shoulders pattern can appear across different timeframes, from intraday to weekly charts. Shorter timeframes typically produce patterns that develop more quickly, leading to shorter-term market moves. Conversely, when the pattern appears on longer timeframes, such as daily or weekly charts, the resulting trend reversal tends to be more significant and enduring. Regardless of the timeframe, it’s crucial to wait for the confirmation of the breakout beyond the neckline before making any trading decisions.
Fast Fact
To confirm the head and shoulders figure on the chart and find optimal entry points, you can use candlestick patterns or technical indicators MACD, RSI, or stochastic.
Structure of the Head and Shoulders Pattern
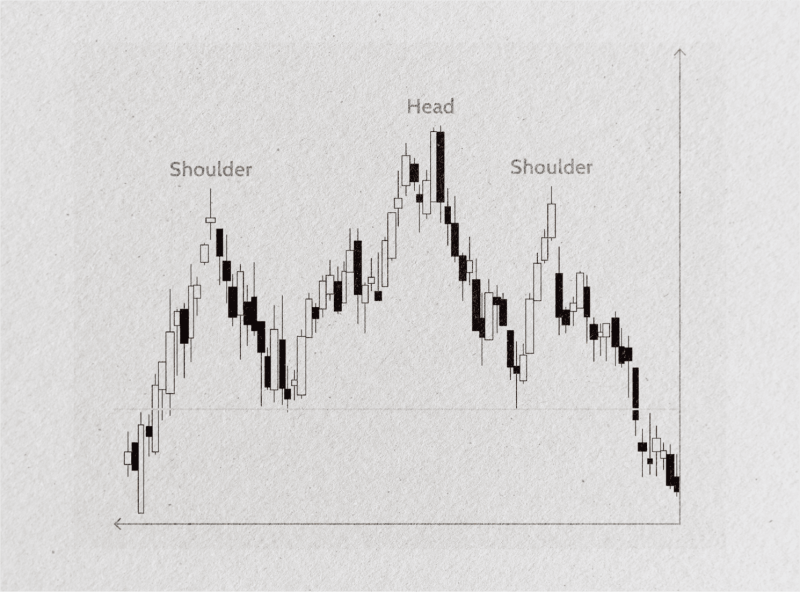
To understand the pattern better, it is essential to break down its components. The left shoulder forms after an upward price movement followed by a pullback. Then, the head emerges as the price climbs again, surpassing the height of the left shoulder, reaching its peak, and eventually falling once more.
Lastly, the right shoulder mirrors the left as the price rises again, but this time, it fails to reach the height of the head. This inability to reach a new high signifies weakness in the prevailing trend, increasing the likelihood of a reversal.
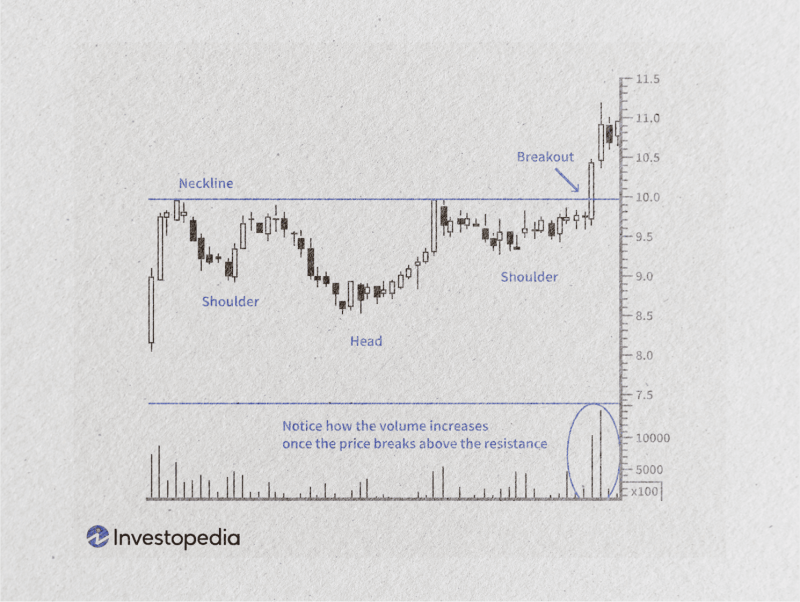
A critical element in this pattern is the neckline, which is formed by connecting the lowest points of the two pullbacks between the head and shoulders. The neckline acts as a support level in the case of a bullish market or a resistance level in a bearish market. When the price breaks through the neckline, it often confirms the reversal, and traders may use this as an entry point for a new position in the opposite direction of the previous trend.
The volume also plays a key role in confirming the pattern. Ideally, the volume should decrease as the pattern forms, particularly during the development of the head and right shoulder. A breakout from the neckline, accompanied by an increase in volume, strengthens the signal that a reversal is underway, giving traders more confidence to act.
Types of Head and Shoulders Patterns
Each formation encountered on the chart during trading has its own peculiarities and varieties, describing one or another scenario of market trend development. Head and shoulders formation is not an exception; there are also certain varieties. Here are the main ones:
Standard Head and Shoulders (Bearish Reversal)
This classic pattern signals a potential reversal from a bullish to a bearish trend. It forms after an uptrend, with three peaks (left shoulder, head, and right shoulder). Once the price breaks below the neckline, it indicates a shift toward a downward trend, suggesting a sell signal.
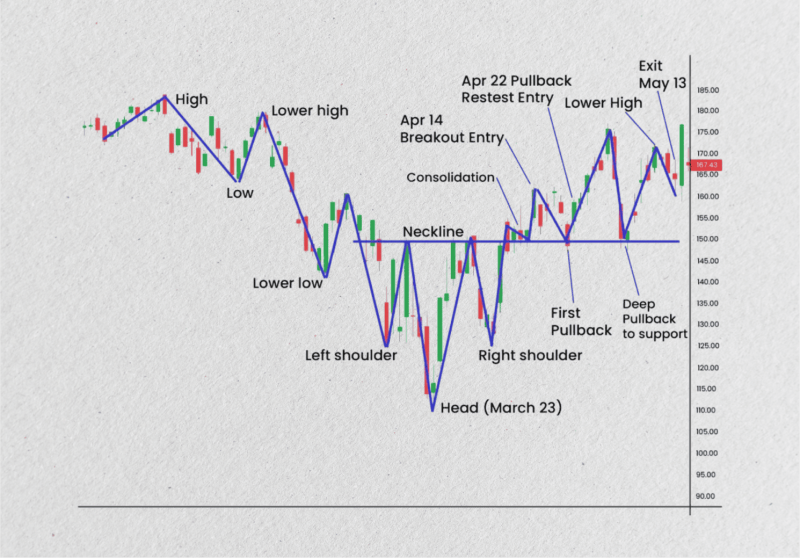
Inverse Head and Shoulders (Bullish Reversal)
This variation signals a reversal from a bearish to a bullish trend. The structure remains the same but appears upside down, with three troughs instead of peaks. It forms after a downtrend, and once the price breaks above the neckline, it suggests a potential upward trend, signaling a buying opportunity.
Complex Head and Shoulders Patterns
In some cases, the head and shoulders or inverse head and shoulders pattern can appear more complex, with multiple peaks and troughs making the structure harder to recognize at first glance.
These patterns still follow the same fundamental principles, but their irregular formations may require more detailed analysis. Complex patterns often occur in highly volatile markets and can provide more reliable signals once confirmed, though they might take longer to develop fully.
Head and Shoulders Continuation Pattern
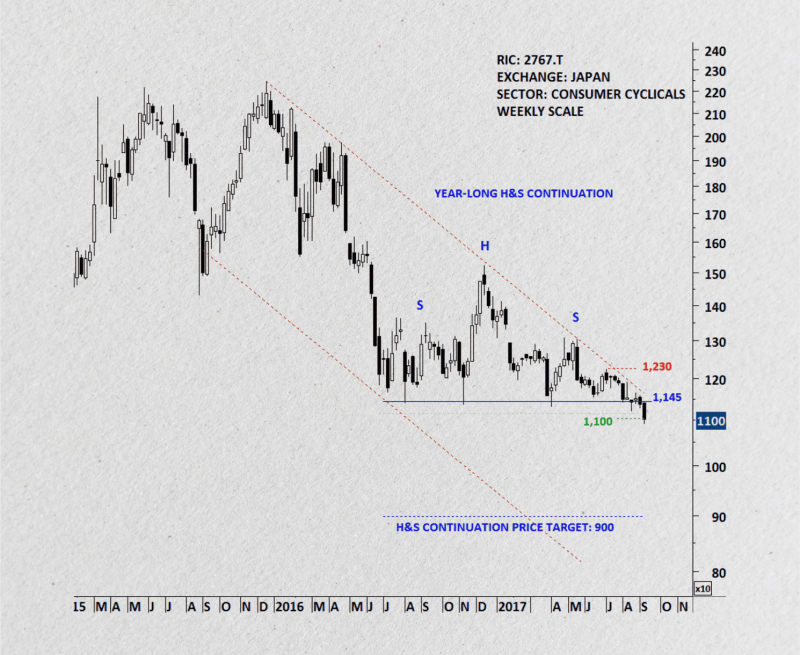
While most traders associate the head and shoulders pattern with trend reversals, a continuation pattern can also occur in rare situations. In this case, after the formation of the pattern, instead of reversing, the price briefly retraces and then continues in the original trend direction. This situation can mislead traders, so combining the pattern with other technical indicators or volume analysis is essential to confirm the market’s next move.
Trading the Head and Shoulders Pattern
The head and shoulders formation is quite simple to interpret on the chart during trading and can be quickly found if you know the principles of its elements formation. At the same time, trading with the help of this pattern involves finding the correct entry and exit points, focusing on the market dynamics and the speed of price changes for the traded assets.
Here is what should be taken into account when trading with this pattern.
Entry Points
The best time to enter a trade using the head and shoulders figure is after the price has broken through the neckline. The neckline acts as a confirmation line, so waiting for the price to close beyond this level helps avoid premature entries. For a bearish reversal (standard head and shoulders), traders would look to enter a short position once the price falls below the neckline.
For a bullish reversal (inverse head and shoulders), a long position is taken when the price breaks above the neckline. Some traders may wait for a retest of the neckline, where the price briefly moves back to the neckline before continuing in the breakout direction, to improve risk-to-reward ratios.
Setting Stop Losses
Risk management is crucial; correctly placing a stop loss can protect against false breakouts. The most common approach is to set the stop loss above (for a short position) or below (for a long position) the right shoulder of the pattern.
This level is considered safe since a price movement beyond this point suggests the pattern has failed. Another option is placing the stop above the head for a more conservative approach, which increases the risk-to-reward ratio.
Profit Targets
To set a profit target, traders typically measure the distance between the head and the neckline (i.e., the pattern’s height). This distance is then projected downwards (for a bearish trade) or upwards (for a bullish trade) from where the price breaks the neckline.
For example, if the height between the head and neckline is 50 points, the profit target would be 50 points below the neckline in a bearish signal or above it in a bullish signal.
Conclusion
The head and shoulders chart formation is a widely respected tool in technical analysis, known for its reliability in signaling trend reversals. Whether in its standard or inverse form, this pattern offers traders valuable insights into potential market shifts, helping them time their entries and exits more effectively.
Traders can capitalize on market movements by understanding their components, properly identifying the pattern, and using appropriate risk management strategies like setting stop losses and profit targets. However, it’s essential to confirm the pattern with additional indicators and stay vigilant for potential false breakouts.
FAQ
What is the head and shoulder pattern?
The head and shoulders pattern is a chart pattern utilized in technical analysis that signals the possibility of a trend reversal. It comprises three peaks, the middle one (the head) being the highest and two smaller peaks on either side (the shoulders).
What does the head and shoulders figure indicate?
The pattern typically signals a reversal of a prevailing trend. A standard head and shoulders formation (bearish) signals the transition from an uptrend to a downtrend, while the Inverse head and shoulders pattern (bullish) suggests a reversal from a downtrend to an uptrend.
How do you identify the pattern?
The pattern is identified by spotting three peaks in a price chart: the left shoulder (a price rise followed by a decline), the head (a higher peak), and the right shoulder (a peak similar to the left shoulder but lower than the head). The neckline connects the troughs between the shoulders and head.
What’s the difference between the standard and inverse patterns?
The standard head and shoulders pattern signals a bearish reversal after an uptrend, while the inverse head and shoulders pattern suggests a bullish reversal after a downtrend. The latter appears upside down compared to the standard pattern.
When is the best time to enter a trade using the pattern?
The optimal entry point occurs after the price breaks the neckline. This break solidifies the reversal, allowing traders to enter a short position (bearish pattern) or a long position (bullish pattern).
How do I set stop losses with this pattern?
For risk management, stop losses are often set above the right shoulder for short positions or below the right shoulder for long positions.
How do I calculate profit targets?
The target price is calculated by measuring the pattern’s height (the distance between the head and the neckline) and projecting that distance from the breakout point after the neckline break.
Which timeframes work best for identifying the formation of the head and shoulders?
While the pattern can appear in any timeframe, it tends to be more reliable in daily, weekly, or longer timeframes, as these provide stronger trend confirmation.

