How to Identify And Trade Using Hammer Candlestick Pattern
Apr 19, 2024

Using patterns and tools, traders evaluate the market to determine the best course of action for their assets – whether to buy, sell, or hold onto them. Candlestick patterns offer valuable information on market psychology and potential shifts in prices. It’s essential that these patterns are easily recognisable and have a high probability of success.
The hammer candlestick pattern, a bullish trading pattern, helps identify trading opportunities. It is one of the most reliable indicators in candle charting, particularly after a market downturn and price support for security.
In this article, we will discuss the benefits and limitations of this trading pattern as well as explore how to trade using the hammer pattern.
Key Takeaways
- Candlesticks are used to monitor and analyze market movements.
- The hammer candlestick is a bullish reversal pattern.
- The hammer candle formation can be either bullish or bearish.
- The pattern has some limitations, such as a high failure rate or false signal generation.
What Is A Hammer Candlestick Pattern?
Candlesticks are essential tools for traders in financial markets to analyze and monitor price movements. These patterns are flexible technical indicators that help gauge market sentiment for financial assets.
The Hammer Candlestick is one of the most popular patterns. It is a bullish reversal pattern indicating a potential price bottom and upward move.
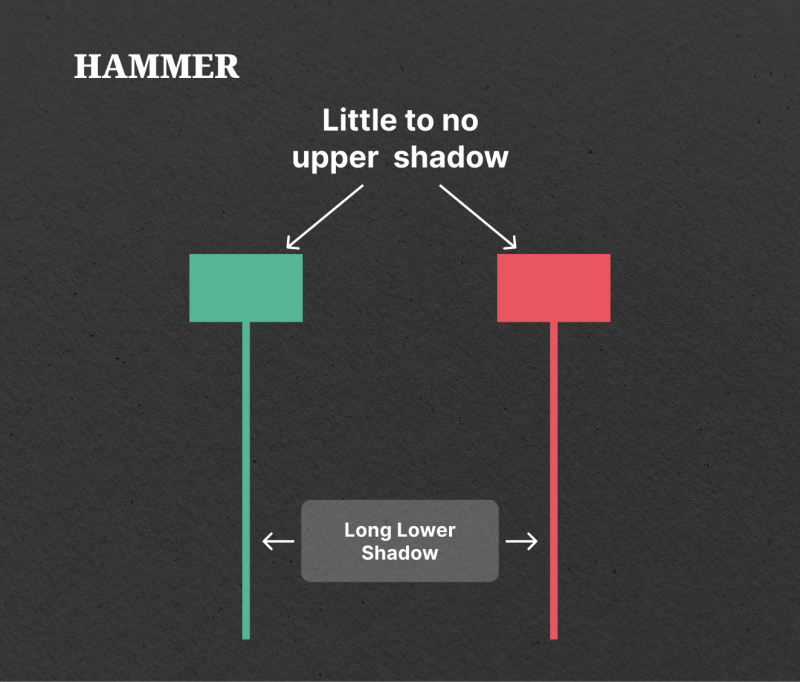
The pattern features a small body at the upper trading range, either green (bullish) or red (bearish), a long lower shadow, indicating that sellers have taken the price down and failed to hold it at the new low, and a small to no upper shadow. To be recognised as a hammer pattern, the lower shadow must be at least twice as long as the body.
The Inverted Hammer pattern indicates the potential for an uptrend following a period of decline. It occurs when the opening, low, and closing prices are approximately the same. The data reflects an increase in selling activity compared to buying activity, resulting in a downward pressure on prices.
After a long downtrend, an Inverted Hammer candlestick pattern is bullish because prices increased significantly during the day, indicating bulls are testing the power of bears. The next day’s events give traders an idea of whether prices will go higher or lower.
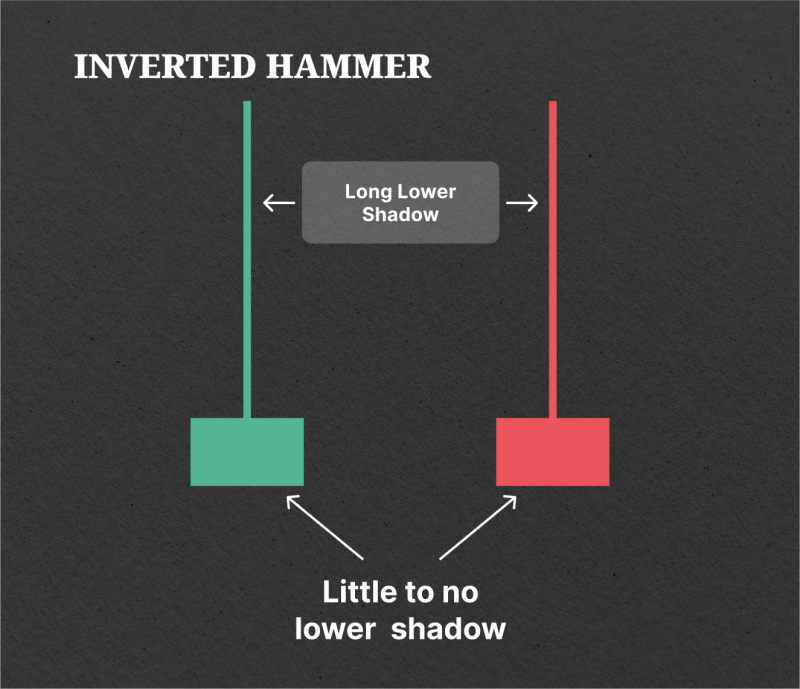
The strength of the hammer’s signal depends on the following conditions: the failure of sellers, the presence of buyers from a random place after a long drop, and the timing of the price action. It appears at the end of a downtrend and indicates that buyers overpowered sellers during a specific trading period. The longer a hammer’s lower wick, the more activity concerning an asset.
The Hammer Chart is a crucial intraday indicator that indicates a shift in bullish/bearish momentum. It confirms or negates potential significant highs or lows by driving prices higher or lower. The significance increases with shadow length and timeframe. Hammers may also confirm or strengthen other reversal indicators.
Bullish Hammer
The bullish Hammer is a single candle pattern that forms after a decline in price, with a small real body at the top and a long lower shadow at least twice the height of the real body.
This pattern indicates that sellers initially drove prices lower intraday before buyers resurfaced and bid prices back up near the open by the end of the period, meaning that buyers reasserted control after substantial selling, making it a high probability reversal sign.
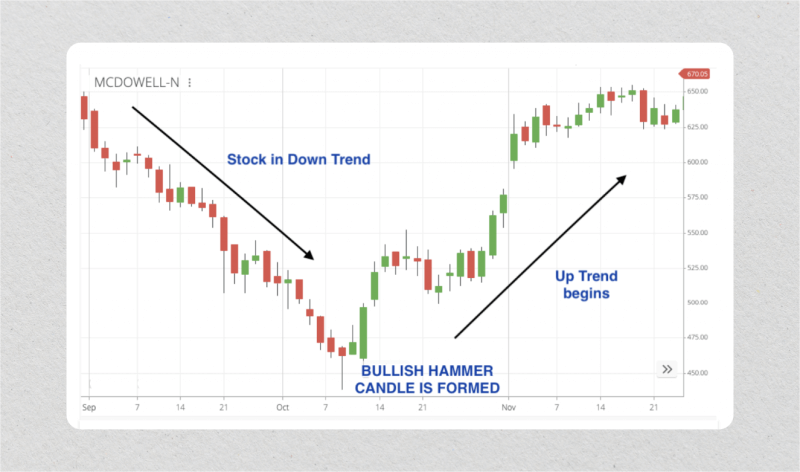
The extended lower shadow indicates that sellers initially took control and drove prices lower, but by the close, buyers had fully absorbed all the selling pressure and brought prices back up near the open.
Traders should look for a bullish hammer candle after a prolonged downtrend or period of selling pressure. The key distinguishing feature of the hammer candle is its lengthy lower tail or shadow, which sets it apart from other single-candle motifs.
Bearish Hammer
The bearish Hammer, also known as a hanging man, is a single candlestick pattern that forms after an advance in price. It has a small real body at the top of the candlestick range and a long lower shadow that is at least twice the height of the real body. The elongated lower shadow indicates that buyers initially pushed prices higher before sellers took control and drove prices back down near the open.
To identify a bearish hammer candlestick, traders should look for it after an uptrend or period of buying pressure. The key distinguishing feature of the bearish hammer candle is its lengthy lower tail or shadow, which sets it apart from other single-candle motifs.
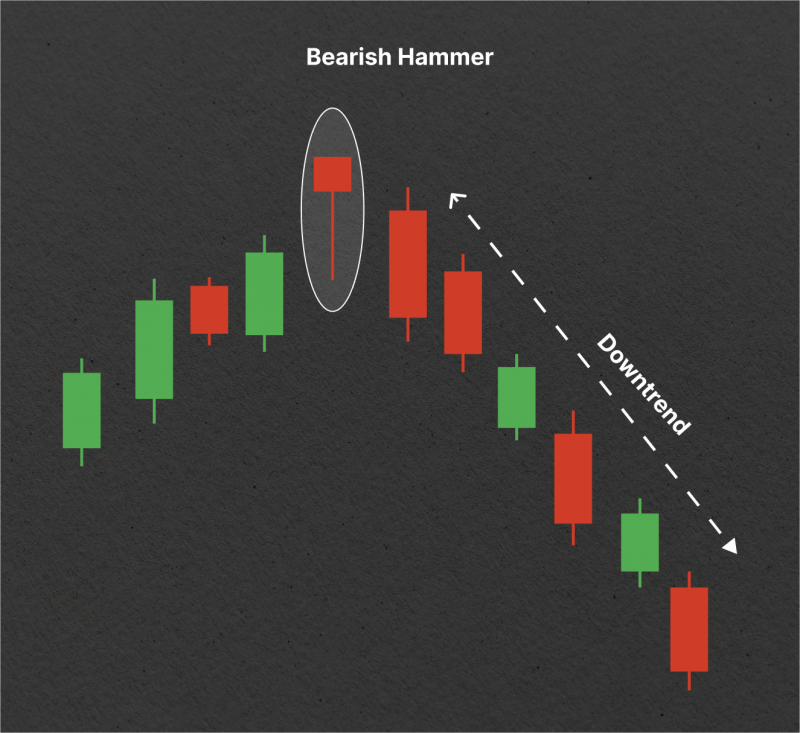
The bearish hammer indicates that intraday buying was overwhelmed by selling pressure, pushing the price back down by the close. It is a high probability reversal sign, reflecting the intense downside rejection of bullish momentum in a single candle.
How to Identify The Formation
Hammer candles are a simple and easily identifiable candlestick pattern on price charts. They can be easily spotted even by beginner traders.
When prices rise after a sell-off closes near the open, a hammer-like candlestick forms. The real body of the candlestick remains modest, but it may be above or below the opening price. The lower shadow must be at least twice as tall, requiring a lengthy lower wick or no upper wick.
It is formed when an asset’s price declines from its opening price, reaching close to the support level, and then bounces back to close at a high. This pattern is found at the bottom of downtrends, indicating that the market is attempting to define a bottom.
The candlestick’s basic interpretation is that it shows a trading period where sellers significantly pushed prices lower, but buying pressure eventually controlled the final price action. The high and closing prices are identical or very close to being identical, indicating strong buying momentum at the close of the trading period.
To identify hammer candles, scan charts for patterns that emerge after a prolonged downtrend, such as a downtrend of at least 5-7% over several sessions or weeks. Check the candle for the right structure and evidence of a price rejection. High-volume hammers show increased participation as the lows were tested, while light-volume hammers lack conviction.
Never take action on a hammer candle alone, and always use other indicators before making any trading decision. Thus, oversold readings on oscillators like RSI add credibility to hammer reversals.
Limitations of A Hammer Candlestick
The hammer candlestick is a reliable price trend indicator in various financial markets, including FX, cryptocurrencies, stocks, and indices. It indicates buying momentum after a new asset low and can be used as both a continuation and reversal pattern, with the potential to identify bullish reversal opportunities early after a extended bear trend.
The Hammer pattern works on various timeframes, making it easy to spot on charts. It can be traded on its own for short-term trades, spotted during sideways ranges, or used to identify potential reversal points in longer-term trends.
However, the hammer has limitations, such as indicating buyers regaining momentum after an asset makes a new low, but also indicating sellers’ retracement. The placement of the hammer is crucial, as incorrect decisions can be made if not found at the bottom of a trend. Other indicators, such as the RSI or stochastic oscillator, can also support the hammer, making its indication reliable.
The main disadvantage of trading based solely on the Hammer candle model is its approximately 40% failure rate, meaning it is prone to generating false signals, which can lead to losing trades.
To enter high-probability trades, traders should look for additional information on the chart that supports the case for a reversal, such as a major level of support, significant Fibonacci level, pivot point, or an overbought signal on the CCI, RSI, or stochastic indicator.
A hammer trade may not be ideal due to the risk and potential reward, as the stop loss may be far from the entry point.
Hammers also require confirmation: the raw hammer signal is considered weak, and waiting for confirmation means missing the initial move.
Also, hammer signals are ineffective during high volatility, tending to perform poorly and generate more whipsaws when volatility spikes.
Market participants intentionally push prices lower to paint a hammer candle and trap bulls into buying, resulting in failed reversals and losses on hammer trades.
How to Trade Using Hammers
The Hammer Candlestick pattern is a significant trading strategy that involves identifying a candlestick with the aforementioned characteristics, waiting for confirmation from the next period’s candlestick, entering the trade at the opening, setting a stop loss below the lowest point, and setting a profit target based on your trading strategy, often aiming for a price equal to twice the stop loss.
The hammer candlestick structure is a popular trading strategy in the stock market, where traders trade long when a bullish hammer forms after a downtrend or short when a bearish hammer appears after an uptrend. This pattern can warn traders when a stock’s trend might be about to reverse, offering key insights into potential market shifts. To trade a hammer, traders must follow the following steps:
1. Identify the pattern after a downtrend of at least 5-7% or a series of lower highs and lows.
2. Confirm the pattern based on the preceding price action and trend. Bullish candles can strengthen the signal, and high volume suggests strong buying pressure. Also, support levels should be checked for reversal.
3. Enter long positions after the bullish confirmation candle closes, placing initial stops below the Hammer’s low to define risk and target at least a 2:1 reward/risk ratio.
4. Manage the trade by sticking to the stop-loss strategy, book partial profits at key overhead resistance levels, and move stops to breakeven once the trade reaches a 1:1 reward/risk ratio.
5. Watch for invalidation, as failure to make a new swing high after entering invalidates the hammer’s bullish potential.
6. Close long positions if the price falls back below the Hammer’s low and watch for downside gaps, bearish engulfing candles, and high volume selling as warning signs.
7. Analyse the results to identify flaws in confirmation rules or timing and continuously refine entry and exit tactics over time.
Examples of Hammer Pattern Trading
Now, let’s take a look at some examples of hammer candlestick patterns.
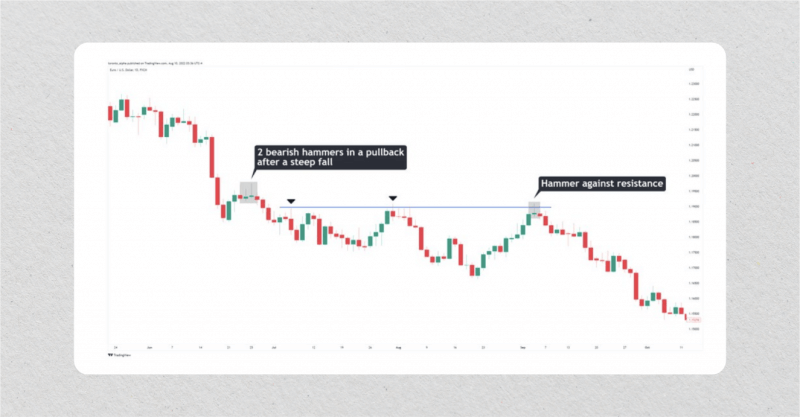
EUR/USD
After a steep drop in the EUR/USD currency pair, the price pulls back, and two inverse hammers appear, signaling the pullback is over. A new resistance level forms at a lower price, and a new hammer rejects this resistance, providing another short-entry opportunity.
WTI Price Drop
The West Texas Intermediate crude oil price experienced a drop in August 2022 but quickly recovered. The hammer candlestick suggests support at the $90 mark, with the potential to surge to $100 if the candlestick breaks. However, a break could lead to a plunge to $80.
Consistent Downward Trend
A stock with a consistent downward trend for 20 periods is forming a Hammer candlestick on the 21st period, with a long green candlestick closing above the Hammer candle, confirming a bullish reversal. An entry could be made at the 23rd period, with a stop loss below the Hammer and a profit target twice the stop loss level. However, trading involves risk and a solid risk assessment strategy is essential.
Final Thoughts
The hammer candlestick pattern signals an optimistic reversal after a downtrend, with buyers regaining control and driving the price back to its initial level. However, sellers may have tried to drive the price lower, suggesting a potential upside price reversal. The rising confirmation candle is typically bought by traders seeking a hammer signal. Positioning a stop loss below the pattern can protect against downward pressure.
The hammer candlestick pattern is a reliable market metric; however, it has some serious limitations, and traders should not rely solely on hammers; instead, they should combine it with other indicators to make profitable trading decisions.
FAQ
How do hanging man and hammer candlesticks differ?
The hanging man indicates a bearish reversal, while a hammer candlestick indicates a bull reversal, depending on the trend in the chart.
What does a red hammer candlestick mean?
A red hammer indicates a potential bullish trend reversal, suggesting buyers could overpower sellers but cannot exceed the asset’s opening price within the trading period.
Is Hammer Candle reliable?
A hammer candlestick pattern is considered a reliable indicator in candlestick charting, particularly after a prolonged downtrend.
What is the best timeframe for a hammer candle stick?
The Hammer pattern strategy is used for trading shares in a day or 60-minute timeframe, with traders often scanning overnight or real-time on a large number of shares due to their rarity.


