Portfolio Backtesting — Tools, Metrics, and Methods Explained
July 03, 2025

Imagine you could travel through time via the markets—pit your investment strategy against boom, bust, and blip ad infinitum without losing a dime? That’s portfolio backtesting‘s practical magic.
Rather than relying on instincts or guesswork, shrewd investors today use historical data to stress test strategies before launching them.
Here, we’ll explore portfolio backtesting’s basics—delving into the top tools, types of strategies, and measures of risk that give real meaning to hypothetical results.
Key Takeaways:
- Portfolio backtesting is essential for validating an investment strategy before risking real capital.
- From QuantConnect to Portfolio Visualizer, each platform suits different investor needs.
- Performance metrics like CAGR, drawdown, and Sharpe ratio offer deeper insights into risk-adjusted returns.
What Does Portfolio Backtesting Stand For?
Backtesting a portfolio is executing an investment or trading idea through historical market data records to simulate its performance. Instead of launching directly into real-time market conditions, investors and traders rely on backtesting for idea verification, executing risk assumptions, and adjusting asset allocation models, all within a safe data-driven environment.

Where portfolio backtesting diverges from solo-strategy testing, though, is in its multi-dimensional nature. You aren’t merely running a solo stock or solo-trade scenario; you’re exploring what a collection of assets would have behaved like if they acted together, in terms of correlations, diversification effects, and common risk exposure.
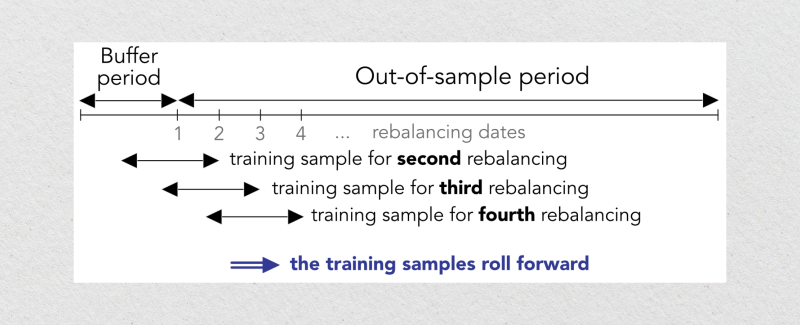
But the real benefit of backtesting moves beyond watching for profits or losses to grasping the “why” behind the numbers. The effective backtest helps you to decompose performance through various market conditions, identify vulnerabilities in your assumptions, and make sensible adjustments before any real capital is risked.
Fast Fact
The concept of portfolio backtesting originated in the 1950s in response to Harry Markowitz’s Modern Portfolio Theory, long before high-speed computers became commonplace.
Key Components of Portfolio Backtesting
A good portfolio backtest is an accurate and exhaustive exercise that allows investors to test after-the-fact investment portfolio performance.
Using the right portfolio backtesting tool, you can get insightful information about what your investment strategy would have yielded in different time frames and market situations.
These are what you need to get started for backtesting a portfolio clearly and confidently.
Historical Data
The basis for any good backtest simulator is good historical data. Unless you begin with data that’s dubious or not granular enough, your backtest will be inaccurate on day one. Whether you’re simulating mutual fund performance, ETF performance, or a proprietary blend of stocks, bonds, and assets, the accuracy of historical returns is most important.
A properly constructed portfolio backtest must account for corporate actions, dividend payments, and market regime shifts. You’d like to test what your investment portfolios would have done in real life, so the more like real-world history your backtesting tool approximates, the better your answers will be.
Strategy Logic and Portfolio Rules
To be able to efficiently backtest portfolio performance, your strategy’s rules have to be crystal clear. These include your asset allocation plan, rebalancing strategies, buy/sell triggers, and exit conditions. You could be investing in a mix of large-cap, mid-cap, and small-cap stocks or changing weightings between funds, bonds, and ETFs.
Your logic must be repeatable and programmable in your portfolio backtester. Rules that are vague only introduce noise and don’t lend themselves well to making comparisons between outcomes or making informed judgments. You can test the portfolio asset allocation’s impact on portfolio performance once your logic is good.
Risk Metrics
A portfolio backtest isn’t complete without a thorough examination of risk measures. More than basic raw return or cumulative return data, you must decide how well your investment strategy managed risk. The Sharpe and Sortino ratio helps you make a judgment of whether your gains were warranted in proportion to the volatility you took.
Statistics like maximum drawdown and standard deviation quantify the amount of downside you would’ve had. They are fundamental metrics that help you comprehend what to expect—yes, not just in terms of gains, but in psychological survival during bad times.
And honestly, backtesting isn’t just about chasing numbers; it’s about designing investment portfolios that are feasible and tolerable in the long term.
Rebalancing Frequency
When you are backtesting asset allocation in a portfolio, rebalancing is highly relevant. Whether you rebalance quarterly, annually, or based on market triggers, you are making a decision that impinges both your total value and your trading costs. Rebalancing holds you to your target allocation among disparate assets and offsets drift caused by market movements.
A well-configured portfolio backtesting tool will allow you to try out different frequencies of rebalancing and examine their effects on the portfolio and month-to-month returns. Too frequent rebalancing, for example, could bleed off gains through costs, and too-rare rebalancing could expose you to risk you don’t intend.
Transaction Costs and Slippage
Also, no practical backtest portfolio ignores frictions. Every trade carries a price—commissions, bid-ask spreads, and slippage that will eat away at your profits. This is most relevant when you test high turnover strategies or manage large funds.
A good backtest portfolio should allow you to input these costs, so your past performance is not aided by unachievable amounts. Proper fee modelling helps you not blur hypothetical gains and potential future performance.
Common Backtesting Strategies
When conducting portfolio backtesting, selecting the right investment strategy to simulate can deliver helpful data for what your investment portfolios would be doing in various market scenarios.
With an efficient portfolio backtesting tool, you can test strategies alongside one another and measure each’s effects on portfolio returns, risk measures, and long-term cumulative returns.
The following are among the most widely used techniques to backtest portfolio performance, and all give a unique insight regarding risk and return.
Buy-and-Hold
The best way to test is through a buy-and-hold approach. This is where you invest in a diversified portfolio of securities—e.g., mutual funds, ETFs, or a mix of mid-cap and large-cap stocks— and just hold them for a definite period of time without any active buying and selling.
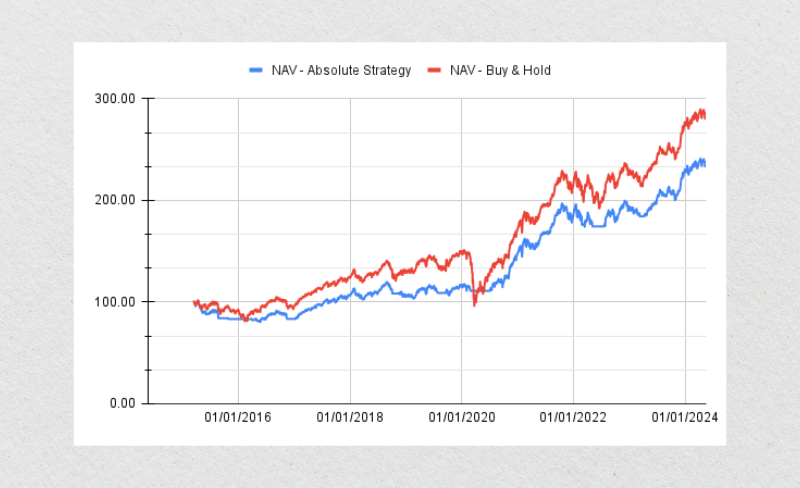
This is optimal for long-term investors for whom keeping it simple, saving money, and minimising taxes is most important. By backtesting portfolio outcomes applying a buy-and-hold strategy, you’ll be able to obtain a clear indication of the asset allocation’s historical record and how market cycles impact your cumulative value.
Factor-Based Portfolios
Factor investing involves deciding to invest in assets based on specific characteristics, referred to as factors, such as value, momentum, or quality. For instance, a value portfolio might invest in undervalued stocks, while a momentum strategy favours assets that have experienced rapid recent gains.
Using portfolio backtests, you can group investment portfolios together based on these themes and study their risk metrics and historical returns. This method becomes especially handy when diversified across a multitude of factors for reducing drawdowns and for long-term improvements in the Sharpe ratio.
Mean-Variance Optimisation
It was pioneered by Harry Markowitz, and it is a mathematical representation employed to calculate the best asset allocation to yield portfolio returns that are optimum for a desired level of risk.
When you backtest your portfolio’s asset mix this way, your portfolio backtesting program shows you automatically the “efficient frontier”—those portfolios which offer the best possible cumulative return for any level of volatility.
It’s a data-driven methodology grounded in quantifiable analysis and is appropriate for users who like to make decisions based on fundamental metrics and correlations.
Risk-Parity Portfolios
Risk parity seeks to invest based on a portfolio’s risk contribution and not capital. Essentially, it provides balanced risk exposure between asset classes like bonds, equities, and commodities.
When you revisit and test a portfolio like this, you are not merely reviewing raw performance; you are also checking if your risk metrics appear balanced within your holdings.
Properly constructed risk-parity-based portfolio backtests generally exhibit smoother return patterns and better stressed-market performance, especially when dealing with mutual fund or combined portfolios.
Trend-Following and Sector Rotation
These are more active methods in response to movement in historical performance or technical readings. Trend-following involves going long on assets going up and shorting or staying away from those going down. Sector rotation transfers investment between sectors based on historical returns and macroeconomic figures.
When backtested through a tool, both strategies enable traders to examine the impact that market timing and active management have on month-to-month returns, total volatility, and forward outcomes.
Traders tend to make more frequent exchanges, so you have to include transaction costs in your portfolio backtests for accurate evaluation.
Tools and Platforms for Portfolio Backtesting
If you’ve wondered if your trading methodology would make it through to next week, the market portfolio backtesting is the solution.
It allows you to simulate your strategy virtually against what’s already occurred in ticks, and demonstrate what would’ve happened if you’d started earlier. And to be able to accomplish that, you’ll need the tool.
Here’s a peek into some well-respected backtesting platforms, each with its own strengths, quirks, and best users. Whether you are a new tinkerer or an experienced quant, you’ll find something that fits your workflow.
QuantConnect
QuantConnect is a comprehensive platform designed for quants and hedge funds. It’s built with the open-source LEAN engine and allows you to write strategies in C# or Python and backtest them in the cloud, fast and accurately. Equities, FX, crypto, futures, and options are all supported, and so is access to high-grade data.
QuantConnect is special in that you can easily transition from backtest to live. You can develop complex, algorithmic strategies in elegant code and test them in a gargantuan dataset with institutional-grade accuracy. It’s not for newbies, though—it has a very steep learning curve if you are not familiar with code.
Backtrader
Backtrader is typically the first port of call for users who prefer to code in Python and want control everywhere in the backtest environment. It’s open-source software, very flexible, and has an active community of traders.
You don’t get platform-type products that obfuscate too much from you; rather, Backtrader gives you a peek under the bonnet and enables you to create your own logic for a strategy from scratch.
It even accommodates live trading, so you can transition from simulation to actual-time trading once you are more experienced. You’ll need to provide your own data, and troubleshooting may involve navigating through community forums. Regardless, for tinkerer coders, it’s a gem.
Portfolio Visualizer
If you don’t particularly like to code, you’ll adore Portfolio Visualizer too. This is a web-based tool that’s simple to use, well-designed, and full of functionality and appropriate for long-term investors and financial planners. You can test asset allocation strategies, back test retirement portfolios and even run Monte Carlo simulations without downloading any software.
It’s most suitable for running passive investment strategies or for comparing asset mix performance. It’s not meant for intraday traders or high-frequency schemes. You can consider it more in terms of a tool for wealth management and not algo-trading.
Amibroker
It’s been around for decades and is a perennial favorite amongst serious technical analysts. It uses its own proprietary scripting language, AFL (Amibroker Formula Language), which, for all its weirdness, becomes very effective after you get accustomed to it. The platform is lightning fast and is hence perfect for BackTesting strategies using voluminous historical data.
It comes complete with charting functions, customisable indicators, and risk measures. You can even link it to data feeds and online brokers. The learning curve is average, and though the interface is somewhat old-fashioned, performance is top-notch.
MATLAB (with Financial Toolbox)
If you work in engineering, data science, or quant finance, your backtesting platform could be MATLAB. Alongside its Financial Toolbox, it enables sophisticated modelling, portfolio optimisation, and signal processing at scale that very few others can muster.
It’s widely used in academic and institutional finance and is ideal for regression analyses, proprietary indicator construction, or market simulators. It’s not, however, cheap—and unless you are employing it during research-intensive events, its potential might be underutilised.
Performance Metrics to Track in Backtesting
Once you’ve run a portfolio backtest, gazing at the end figure and deciding whether a strategy “worked” is not enough. Real insight is derived from investigating performance metrics—the figures that describe how your strategy behaved under various conditions.
These measures provide you with a more comprehensive view of risk, consistency, and efficiency, so you can make better decisions before you implement your strategy.
Let’s take a dive into some of the most helpful metrics you’ll want to track during portfolio backtests.
CAGR (Compound Annual Growth Rate)
CAGR is likely the best way to encapsulate a long-term history of an investment portfolio’s performance in simple language. It’s the average annual percentage gain you would have had to make during each year to transform the portfolio from its starting value to its ending value.

This metric balances out highs and lows to allow investors to appropriately compare differing strategies. While it provides a good snapshot of portfolio performance, it provides no insight into how bumpy the ride was, so it’s best used in combination with measures of risk and volatility.
Maximum Drawdown
This metric captures your portfolio’s highest peak-to-trough loss during any time period for which you’ve run the portfolio backtest. This is most easily explained in simple terms: “How much would I have lost if I had invested at the worst time?”
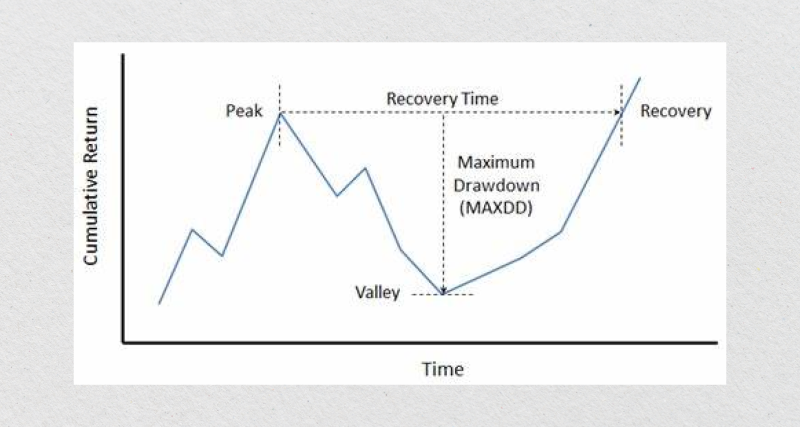
It’s especially useful for understanding emotional risk—those painful losses that induce investors to abandon an otherwise good investment scheme. A high CAGR is nice, but if maximum drawdown is equally severe, the scheme might be too volatile for most investors to tolerate.
Sharpe Ratio and Sortino Ratio
The Sharpe ratio measures portfolio efficiency by evaluating its return on the amount of risk taken. A higher Sharpe ratio indicates greater total returns per unit of risk, making it a common feature in most performance summaries.
The Sortino ratio is a close cousin—arguably superior—because it focuses solely on downside risk. After all, few investors are concerned about upside surprises.
These fundamental measures are especially useful when comparing strategies that deliver similar overall portfolio performance but behave very differently during periods of market volatility.
Calmar Ratio
The Calmar ratio equals the Compound Annual Growth Rate divided by the greatest drawdown. It’s an accurate way to compare strategies that earn similar returns but differ in terms of how much money they risk.

If both portfolios had sustained a 10% CAGR, but one experienced a 15% drawdown and the other a 35% decline, the Calmar ratio would immediately indicate which is more resilient. For most, this ratio balances risk and reward fairly well.
Alpha, Beta, and R-squared
These three measures provide you with more information about your portfolio’s performance within a larger market or selected benchmark. Rather than relying just on absolute portfolio performance, they enable you to gain insight into your strategy’s performance versus others and the kind of risk exposure it represents.
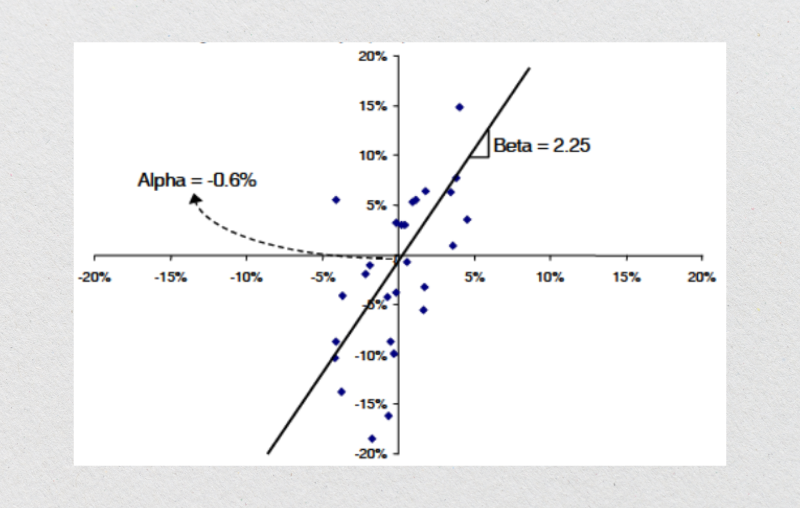
Alpha quantifies the proportion of portfolio performance that cannot be explained based just on market action. It effectively measures value added—or deducted—through your investment technique beyond what took place in the market.
A good alpha is generally regarded as a sign of skill or superior asset allocation judgments, and a bad alpha can be a sign of poor timing or a lackluster strategy.
Beta, though, assesses just how reactive your portfolio is to market movement in general. A beta of 1 indicates your portfolio moves and drops along with the market.
A beta below 1 indicates it’s not quite so volatile—perhaps more conservative—whereas any beta above 1 indicates your portfolio tends to react more vigorously to market movement, and it holds more risk both during bull and bear conditions.
R-squared connects the two together by showing you what percentage of your portfolio’s behavior is indeed explained by the benchmark. You’ll get a high R-squared (nearer 100%) if your portfolio follows the market index fairly closely, and you’ll get a low R-squared if it diverges quite noticeably, perhaps because you’re pursuing more active or specialised strategies.
Conclusion
Portfolio backtesting isn’t about predicting the future—it’s about preparing for it with purpose. By analysing how your investment ideas would have played out across past markets, you build a clearer roadmap for what’s possible ahead.
But beyond the numbers, backtesting teaches discipline. It challenges assumptions, sharpens strategy logic, and forces you to think not just about returns but about how those returns were earned—and at what cost.
Metrics like alpha, drawdown, and the Sharpe ratio don’t just crunch figures—they tell stories of risk, reward, and resilience.
FAQ
What is the purpose of portfolio backtesting?
To simulate how a portfolio would have performed in the past, helping investors evaluate the viability and risk of a strategy.
Can backtesting predict future results?
Not exactly. Backtesting reveals how a strategy would have performed, but it doesn’t guarantee the same results going forward.
Do I need coding skills to backtest a portfolio?
Not always. Tools like Portfolio Visualizer are beginner-friendly, while platforms like Backtrader or QuantConnect require coding.
How much historical data is enough?
At least 5–10 years is recommended, depending on the strategy’s timeframe and the market conditions you want to include.


