Stock Chart Patterns Cheat Sheet for Successful Trading
Mar 29, 2024

Imagine wanting to solve an equation and not knowing any formulas or trying to get the answer to a geometric problem without, for example, understanding the Pythagorean theorem. This is what trading without knowing the proper strategies is like.
When operating on stock markets, several critical factors can determine your success or failure. One of such decisive aspects is being skilled in decoding the language of charts. Trading patterns act as traders’ guiding stars, so it’s essential to master the art of interpreting these visual signals.
Key Takeaways:
- Mastering stock chart patterns is important for decoding market trends and making wise trading selections.
- Continuation and reversal patterns offer priceless insights into potential trend shifts, guiding traders in overcoming market volatility.
- By utilizing pattern recognition tools and combining technical analysis with fundamental factors, traders can enhance their trading strategies and maximize profitability.
Translating the Technical Patterns
Before we dive into the cheat sheet, let’s understand the fundamentals. Stock chart patterns, the fingerprints of market movements, serve as the cornerstone of technical analysis. They are the visual representations of the battle between bulls and bears, offering valuable insights into potential trend shifts.
All the chart patterns are visual representations of price movements in the stock market over a certain period. These patterns occur from the fluctuations in supply and demand dynamics as investors buy and sell securities.
Common chart patterns include head and shoulders, triangles, flags, pennants, and double tops or bottoms, among others. Each pattern has its significance and can provide insights into potential future price movements.
Importance of Recognising Patterns in Technical Analysis
Recognizing patterns in technical analysis is crucial for traders and investors as it helps them make informed decisions about buying, selling, or holding securities.
By studying historical price movements and identifying recurring patterns, analysts can anticipate potential future price movements and develop trading strategies accordingly. Patterns provide valuable information about market sentiment, trend reversals, and potential breakout or breakdown points, helping traders manage risk and maximize profits.
Additionally, patterns can serve as confirmation signals when used with other technical indicators, enhancing the overall effectiveness of technical analysis.
Overall, understanding and recognizing stock chart patterns are essential skills for anyone involved in trading or investing in the financial markets.
Fast Fact:
Candlestick charts are thought to have been developed in the 18th century by Munehisa Homma, a Japanese rice trader. They were introduced to the Western world by Steve Nison in his book Japanese Candlestick Charting Techniques, first published in 1991.
Continuation Patterns: Riding the Trend
Continuation patterns signify temporary pauses in existing trends. As the name suggests, these patterns indicate a resumption of the prevailing trend after a brief break.
Flag
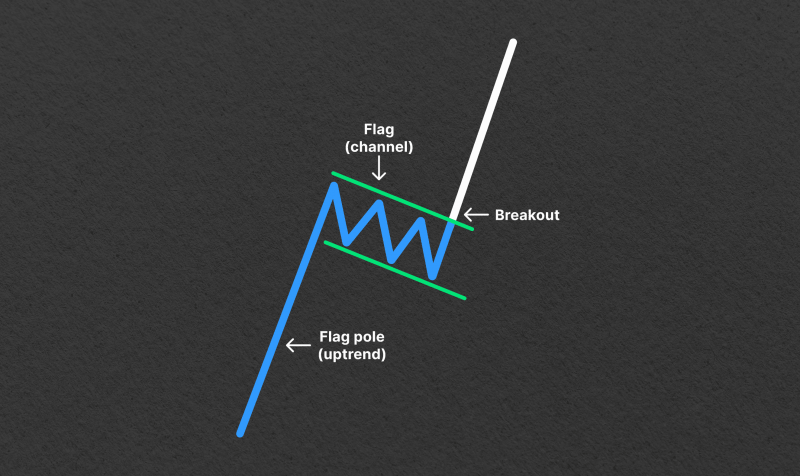
The flag pattern is a short-term continuation pattern that forms after a substantial price movement (up or down), resembling a flag on a pole. It consists of two parallel trendlines: a sharp price movement (the flagpole) and a consolidation period (the flag).
- Flagpole: The initial strong price movement, often accompanied by high volume.
- Flag: A consolidation period characterized by lower volume and sideways price movement.
- Continuation: The flag pattern typically precedes a continuation of the prior trend.
- Duration: Flags are usually brief, lasting several days to a few weeks.
Operational Strategy:
Entry: Long positions are initiated when the price breaks above the flag’s upper trendline; short positions are initiated when the price breaks below the lower trendline.
Stop-loss: Placed below the low of the flag (for long positions) or above the high of the flag (for short positions).
Target: The flagpole length can be used to estimate the potential target after the breakout.
Pennant
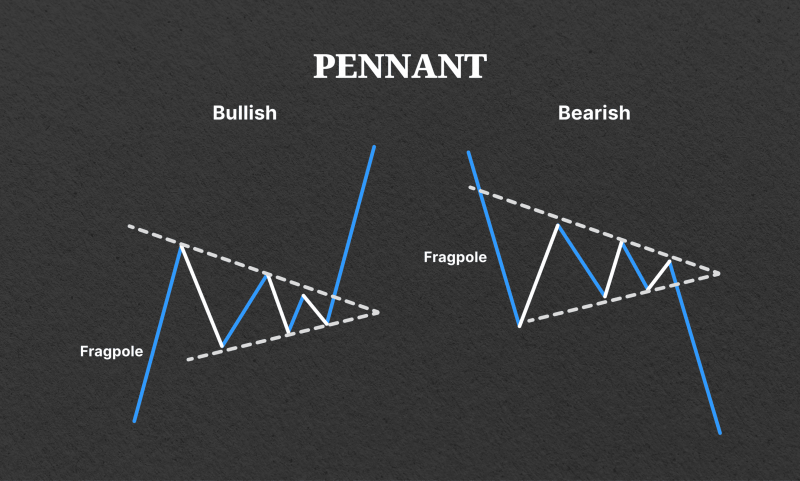
The pennant pattern is a short-term continuation pattern that resembles a small symmetrical triangle. It forms after a substantial price movement (like a flag) and represents a brief consolidation period before continuing the prior trend.
- Flagpole: The initial sharp price movement.
- Pennant: A small symmetrical triangle formed during the consolidation phase.
- Continuation: Pennants typically precede a continuation of the prior trend.
- Duration: Pennants are usually short-lived, lasting a few days to a couple of weeks.
Working Strategy:
Entry: Long positions are initiated when the price breaks above the pennant’s upper trendline; short positions are initiated when the price breaks below the lower trendline.
Stop-loss: Placed below the low of the pennant (for long positions) or above the high of the pennant (for short positions).
Target: The flagpole length can be used to estimate the potential target after the breakout.
Rectangle
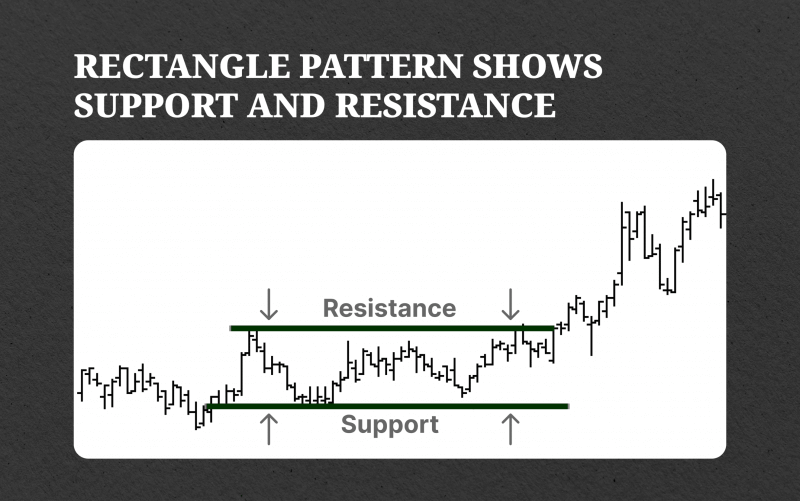
The rectangle pattern, also known as a trading range or congestion zone, forms when the price oscillates between two parallel horizontal trendlines, representing support and resistance levels. It signifies a period of consolidation or indecision in the market.
- Support and Resistance: The upper and lower trendlines act as support and resistance levels.
- Range-Bound: Prices tend to trade within the boundaries of the rectangle pattern.
- Breakout: A breakout occurs when the price breaks above the resistance or below the support, signaling the continuation of the prior trend.
Trading Method:
Entry: Long positions are initiated when the price breaks above the upper trendline of the rectangle; short positions are initiated when the price breaks below the lower trendline.
Stop-loss: Placed below the support level (for long positions) or above the resistance level (for short positions).
Target: The height of the rectangle pattern can be used to estimate the potential target after the breakout.
Reversal Patterns: Spotting the Turning Tide
On the flip side, reversal patterns indicate potential trend reversals. They mark the battleground where bulls surrender to bears or vice versa. Head and shoulders, double tops, and double bottoms are among the classic reversal patterns that signal impending trend shifts.
Head and Shoulders
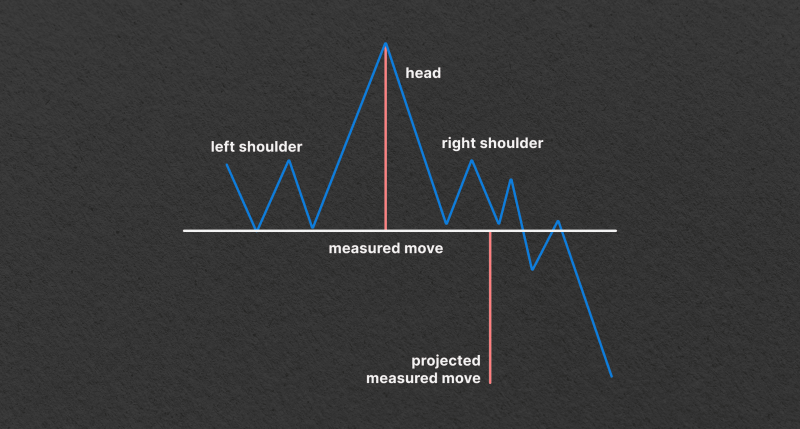
The head and shoulders pattern is a reversal pattern that typically forms after an uptrend and signals a potential trend reversal. It consists of three peaks: a higher peak (the head) between two lower peaks (the shoulders). The neckline, drawn by connecting the lows between the peaks, serves as a critical level of support.
- Head: The highest peak in the pattern, representing the peak price reached during the trend.
- Shoulders: Two lower peaks on either side of the head, indicating weakening momentum.
- Neckline: A support level formed by connecting the lows of the troughs between the peaks.
- Volume: Generally, volume decreases as the pattern forms and increases upon the breakout.
- Breakout: A confirmed breakdown below the neckline suggests a bearish trend reversal.
Operational Strategy:
Entry: Short positions are initiated once the price breaks below the neckline.
Stop-loss: Placed above the right shoulder to limit potential losses.
Target: The distance from the head to the neckline can be used to estimate the potential downward target.
Double Top/Bottom
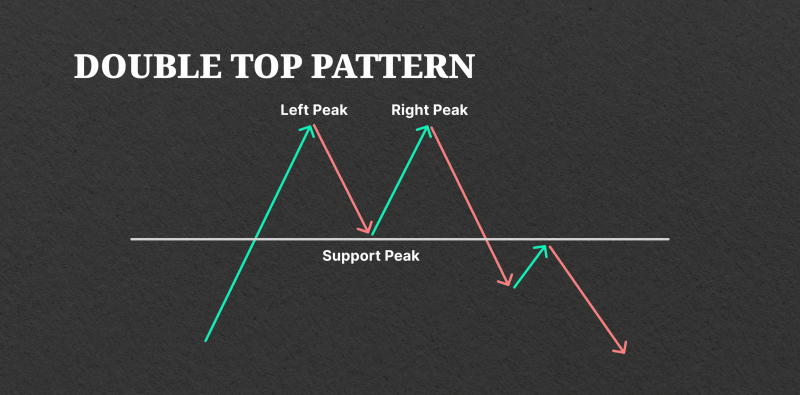
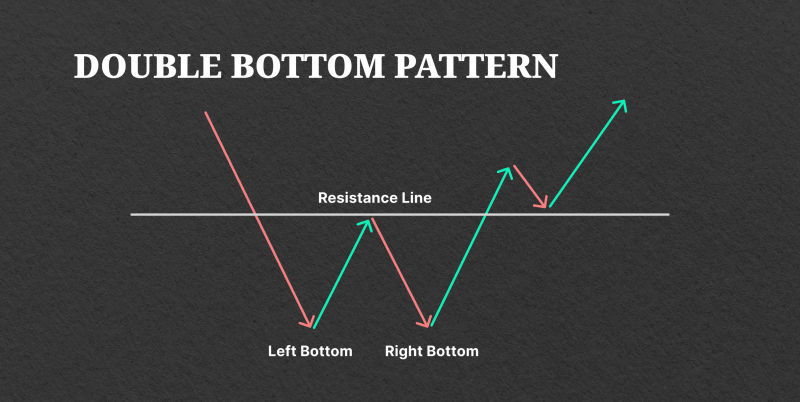
Double Top is one of the bearish chart patterns formed by two peaks at approximately the same price level, separated by a trough. Double Bottom is one of the bullish chart patterns characterised by two troughs at roughly the same price level, separated by a peak.
- Resistance/Support: The peaks/troughs act as resistance/support levels.
- Breakout: Confirmation occurs when the price breaks below the support (double Top) or above the resistance (double Bottom).
- Volume: Volume typically decreases as the pattern forms and increases upon the breakout.
Working Guideline:
Entry: Short positions for double tops are initiated after the breakdown below support; long positions for double bottoms are commenced after the breakout above resistance.
Stop-loss: Placed above the highest point of the pattern for short positions and below the lowest point for long positions.
Target: The distance between the top/bottom and the neckline can be used to estimate the potential target.
Triangles (Ascending, Descending, Symmetrical)
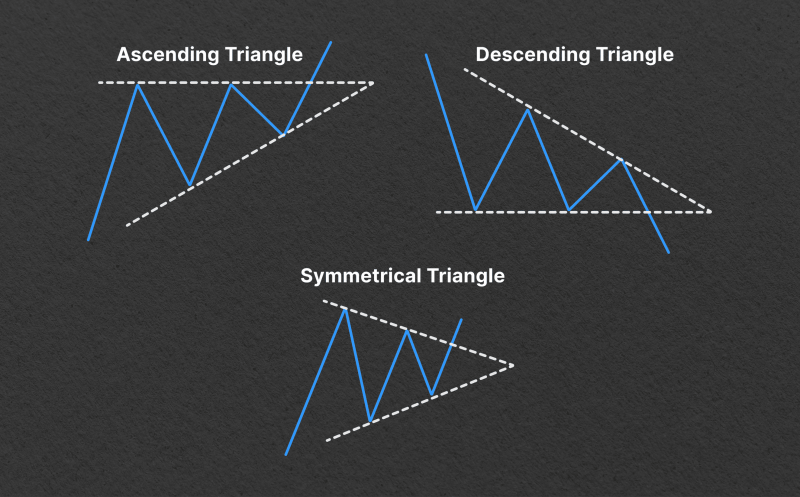
An Ascending Triangle is a bullish continuation chart pattern characterized by a horizontal resistance line and an upward-sloping support line.
A Descending Triangle is a bearish pattern characterized by a horizontal support line and a downward-sloping resistance line.
A symmetrical Triangle is a neutral pattern formed by converging trendlines representing a period of consolidation before a breakout.
- Support and Resistance: The converging trendlines represent tightening trading ranges.
- Breakout: Confirmation occurs when the price breaks above resistance (ascending Triangle) or below support (descending/symmetrical Triangle).
- Volume: Typically decreases as the pattern forms and increases upon the breakout.
Trading Strategy:
Entry: Long positions for ascending triangles are initiated after the breakout above resistance; short positions for descending triangles are commenced after the breakdown below support.
Stop-loss: Placed below the trendline for long positions and above the trendline for short positions.
Target: The height of the Triangle can be used to estimate the potential target after the breakout.
Cup and Handle
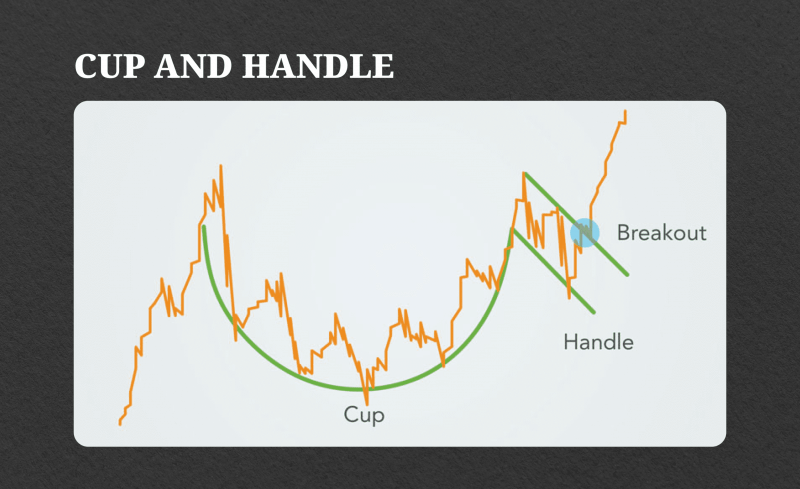
The cup and handle pattern is a bullish reversal pattern resembling a teacup with a handle. It consists of two parts: the cup, which forms a rounded bottom, and a smaller consolidation period known as the handle.
- Cup: The initial part of the pattern where the price forms a rounded bottom, indicating a prolonged downtrend followed by a gradual recovery.
- Handle: A consolidation period with lower trading volume and relatively stable prices, usually forming a smaller downward-sloping trendline.
- Breakout: Confirmation occurs when the price breaks above the resistance level formed by the peak of the cup, signaling a bullish trend reversal.
Trading Plan:
Entry: Long positions are initiated when the price breaks above the resistance level after the formation of the handle.
Stop-loss: Placed below the lowest point of the cup or the handle to limit potential losses.
Target: The height of the cup can be added to the breakout point to estimate the potential target.
Recognizing these patterns can be daunting, especially for beginners. However, identifying chart patterns becomes easy with pattern recognition scanners integrated into trading platforms.
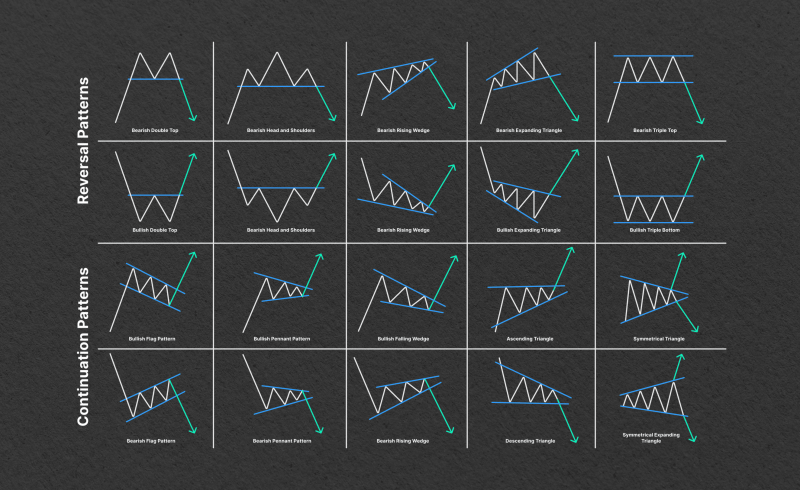
Stock Chart Patterns Cheat Sheet: Your Roadmap to Success
Now that you comprehensively understand the essential stock chart patterns and the tools to identify them, it’s time to put your knowledge into action. Here’s how you can use your cheat sheet for trading success:
1. Familiarise yourself with each pattern by studying charts and practicing pattern recognition. The more you expose yourself to different scenarios, the better equipped you’ll be to identify patterns in real-time.
2. Take advantage of pattern recognition scanners available on trading platforms. These tools analyze vast amounts of past market data to identify potential trading opportunities, saving you time and effort.
3. While the basic chart patterns provide valuable insights, combining them with fundamental analysis can enhance your trading strategy. Consider company earnings, industry trends, and economic indicators to make well-informed decisions.
4. Stick to your trading plan and remain disciplined in your approach. Emotions can cloud judgment, leading to impulsive decisions. Trust in your chart analysis and stay patient during volatile market conditions.
The stock market is dynamic, and trading strategies must develop with changing market conditions. Stay updated with market trends, attend seminars, and engage with fellow traders to continuously refine your skills.
Conclusion
With your stock chart pattern cheat sheet and cutting-edge tools, you can confidently operate in the stock market. Whether you’re a novice or a seasoned trader, mastering these patterns is the key to unlocking profitable opportunities amidst market volatility.


