The Cup and Handle Pattern – How Trade Using This Bullish Indicator?
Feb 11, 2025

Traders use a combination of technical indicators and chart options to observe market activities and price action. These tools help make the right trading decisions at the right time.
Prices fluctuate broadly in the free flow of financial markets and assets, and tracking these movements is crucial for predicting future trajectories and gauging traders’ sentiments.
The Cup and Handle pattern is a graphical illustration of price fluctuations commonly found in bullish markets. The naming comes from the resemblance of a cup bottom and a drifting handle on the side.
Due to its volatile trajectory, this technical chart pattern can be misleading for many. Let’s explore how it works and how you can trade with this indicator.
Key Takeaways
- The Cup and Handle chart pattern reflects a period of consolidation followed by rising volume and a bullish breakout.
- The pattern is more effective in established trends than in volatile, unpredictable markets.
- Traders use these charts to make decisions about market entry, stop-loss limits, and locating price breakouts.
What is The Cup and Handle Pattern?
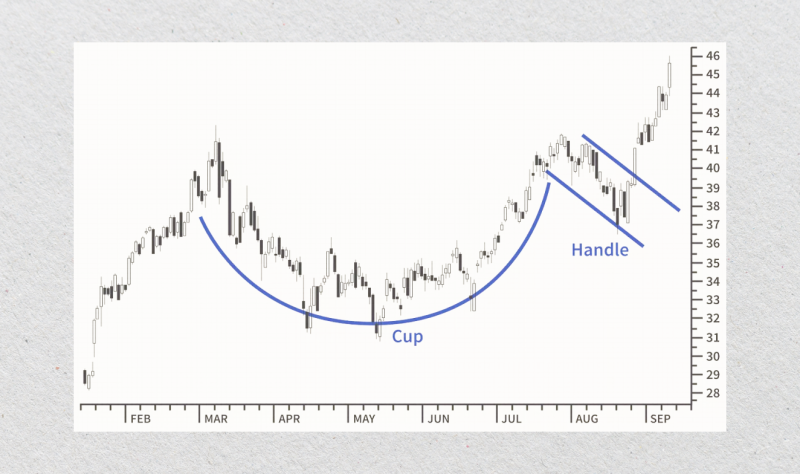
The Cup and Handle is a bullish chart pattern typically occurring during an uptrend. It consists of two parts: a rounded “cup” followed by a brief consolidation or pullback, known as the “handle.”
The pattern is completed when the price breaks above the handle’s resistance level, signaling a potential upward breakout. Traders can use this pattern to identify entry points for long positions, with the cup representing a gradual price recovery and the handle symbolizing a brief pause before further upward momentum.
It works best in markets with established bullish trends, and participants chase higher price breakouts.
What Makes it a Good Trading Indicator?
The Cup and Handle is an effective tracking method because it provides clear signals for price breakouts. Its structure highlights shifts in market sentiment, with the cup bottom showing accumulation and the handle confirming a bullish continuation pattern.
When the trading volume increases at the end of the pattern, it indicates more persistent price movements and a high probability of success for long positions.
Foundation and Development
William J. O’Neil, a renowned investor and author of How to Make Money in Stocks, first identified the cup-and-handle pattern.
William described this pattern as a reliable tool for recognizing growing stocks poised for upward movement. Its formation reflects market psychology:
- The “cup” pattern represents a recovery phase as selling pressure eases.
- The “handle” is a final consolidation before buyers regain full control.
O’Neil observed that this pattern works across various timeframes and is particularly effective when paired with fundamental and technical analysis. Thus, it is vital for traders seeking high-probability entry points in bullish markets.
Fast Fact
The cup shape can take anywhere from 7 weeks to 65 weeks to form, making it more suitable for position traders.
Explaining The Cup and Handle in Trading
The Cup and Handle formation is composed of three key elements:
The Cup: A rounded, U-shaped bottom that indicates a period of consolidation. Ideally, The cup’s depth should not retrace more than 50% of the prior uptrend. Symmetrical and shallow cups are more reliable.
The Handle: A brief pullback or consolidation period following the cup. Handles often take the form of a small descending branch, suggesting sideways movement. The depth of the handle should not exceed one-third of the cup’s height.
Breakout: The pattern is considered completed when the price moves above the handle’s resistance level, usually accompanied by increased volume, confirming a handle pattern bullish breakout.
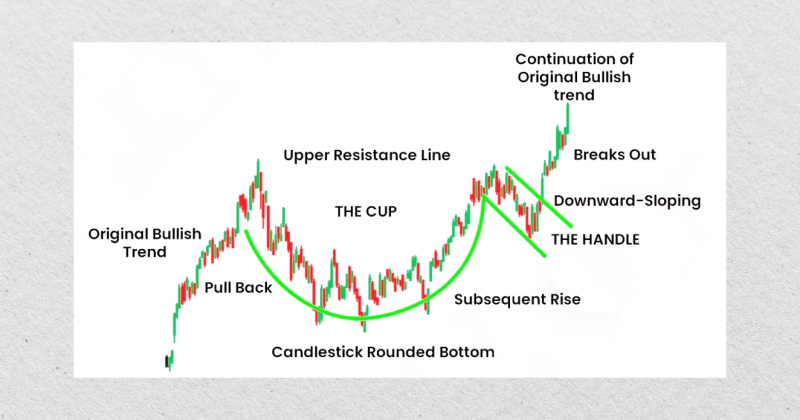
Look for strong uptrends on daily or weekly charts to locate these patterns. Formation can take weeks to months, depending on the market and timeframe. Here’s how you can find this pattern to anticipate market movements effectively:
- Ensure the cup has a rounded bottom instead of a sharp V-shape.
- Confirm the breakout with higher trading volume after the handle.
- Draw trendlines to mark the resistance and support levels near the handle’s form.
How to Trade Cup and Handle Patterns?
You can use the pattern to trade in different markets and assets. However, it is more effective during established trends than highly volatile ones because the consolidation period takes time to form, and breakouts must stand out more clearly. Here’s how you can use it:
- Identify the Pattern: Spot a U-shaped rounded bottom “cup” followed by a small drifting channel “handle.”
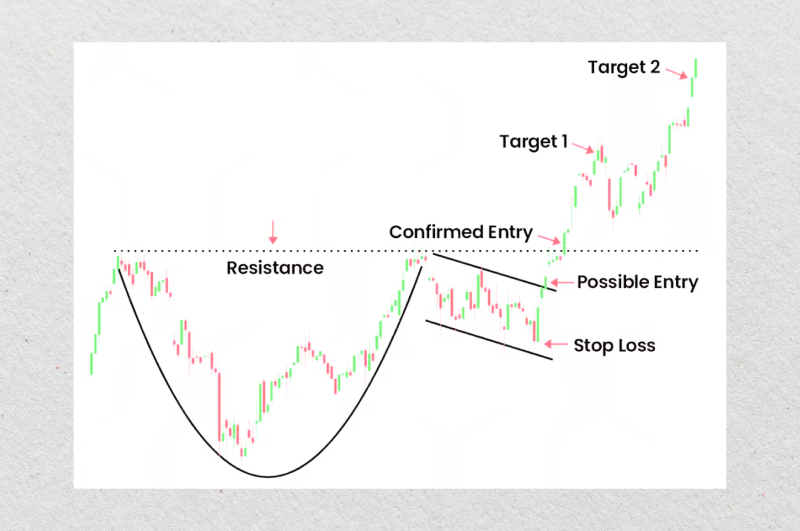
- Enter the Trade: Enter a long (buy) position when the price breaks above the handle’s resistance level.
- Set a Stop-Loss: To minimize risk if the breakout does not persist, place the stop-loss slightly below the handle’s low.
- Determine Target Price: Measure the depth of the cup and add it to the breakout point to estimate potential profit.
Other Variations
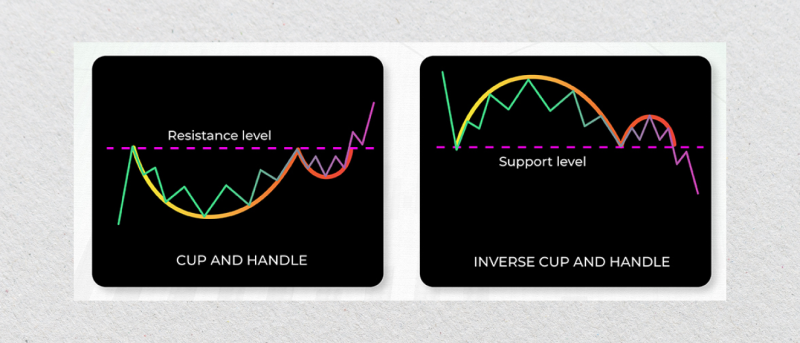
There are several chart variations, each serving different market conditions. You can combine these variations with technical indicators to track trading volumes or trend strength.
- Inverted Cup and Handle: A bearish pattern is created with a cup forming an upside-down U-shape. This inversion signals a potential downward trend for short-selling opportunities.
- Extended Handle: The handle may take longer to form in some cases, creating a sideways consolidation. This may delay the breakout for some time but often results in a stronger price movement once the resistance line is broken.
- V-shaped Cups: In volatile markets, the pattern may form a sharp, V-shaped bottom instead of a rounded U-cup. This pattern still indicates bullish sentiment, but it is less reliable.
Benefits and Limitations
While the “cup and handle” is a good indicator to detect entry points in bullish markets and predict potential movements, there are some pitfalls that you must consider. It can be prone to false readings, and its variations are not easily understood. Let’s review the pros and cons.
Benefits
- Clear Entry and Exit Points: The pattern provides clear levels for entering and exiting trades, improving decision-making.
- High Success Rate: The Cup and Handle is highly reliable for capitalizing on bullish continuations if correctly identified.
- Versatility: The pattern can be applied across different timeframes and markets, including stocks, Forex, and cryptocurrencies.
- Risk Management: The handle’s depth helps find stop-loss levels, simplifying order placement and minimizing potential losses.
Limitations
- False Breakouts: A breakout can happen without sufficient volume, leading to losses if the move reverses afterward.
- Time-Consuming: The pattern can take weeks or months to form, making it inadequate during fast-paced markets.
- Market Dependency: The pattern works best in steady markets, while it is less reliable in sideways or volatile conditions.
- Complex Variations: Deviations from the ideal shape can lead to misinterpretation, especially for beginner traders.
How to Apply The Cup and Handle Pattern?
Applying the pattern accurately requires integrating it with technical tools and strategies. By combining it with additional indicators, you can optimize accuracy and fine-tune your decision-making process. Here’s how you can start.
Step 1: Use Charts to Identify the Pattern
Analyze daily or weekly candlestick charts to spot the cup-and-handle pattern formation. Look for a rounded, U-shaped recovery that forms the cup, followed by a short consolidation or pullback phase that forms the handle.
Use trendlines to clearly mark the resistance at the top of the handle and the support levels to define the pattern’s boundaries.
The volume-weighted Average Price (VWAP) indicator can help you identify key price levels where the pattern forms, improving the clarity of your trading strategy.
Step 2: Confirm with Volume Analysis
Track the trading volume as the price line approaches the handle’s resistance level. A breakout above the resistance is usually accompanied by a surge in volume, which indicates strong buying interest.
You can also use the Relative Strength Index (RSI). If the index score is above 50, it indicates bullish momentum, and the breakout is more likely to succeed. However, avoid entering when the RSI score is above 70, as this indicates overbuying, and the trend may switch at any time.
Step 3: Validate The Momentum
Once the breakout occurs, use the Moving Average Convergence Divergence to validate market momentum.
Look for a MACD crossover, where the MACD line crosses above the signal line, confirming that upward momentum is building. This step ensures that the breakout has potential and is not a false signal. You can also combine this with volume analysis for stronger confirmation.
Step 4: Set Price Targets
Estimate your profit target using the depth of the cup (distance from the cup’s lowest point to the resistance line) and add it to the breakout price.
Using MA indicators (such as the 50-day or 200-day SMA), you can measure whether the price is also moving above its historical price average. This can confirm the breakout’s strength and provide further profit targets.
Step 5: Manage Risk with Stop-Losses
To protect against losses if the breakout fails, place your stop-loss limit just below the handle’s lowest point.
Use the RSI to assess the risk of entering too late or in the overbought zone, where the risk-to-reward ratio might no longer be profitable. Adjust your position size accordingly to ensure a balance between risk and potential reward.
Conclusion
The Cup and Handle pattern is a popular chart formation during bullish markets. It illustrates a consolidation period followed by rising buying pressure, indicating an upward trend.
It is less effective in highly volatile markets, where patterns can be unreliable and prone to failure. However, it is most effective in steady, trending markets, where price movements follow a more predictable layout and breakouts can be tracked more easily.


