What is a Liquidity Sweep? How to Trade It?
Aug 09, 2024
Traders are always seeking ways to gain an edge in the market and maximize profits. A critical factor influencing trading strategies is liquidity. Numerous tactics revolve around this concept, with one of the most prominent, especially among smart money traders, being the identification of liquidity sweeps.
In this article, we’ll delve into the intricacies of liquidity sweeps, explore their impact on market dynamics, and uncover practical techniques to leverage these events for enhanced trading performance.
Key Takeaways
- Liquidity zones are significant concentrations of resting orders.
- Liquidity sweeps are powerful market events initiated by institutional players to collect stop orders of retail investors.
- A liquidity void is a sudden imbalance between buyers and sellers, causing rapid price changes.
- In traditional markets, brokers ensure liquidity by routing orders to liquidity providers, while in DeFi, liquidity is supported by AMMs and liquidity pools.
What Is Market Liquidity?
In a broader sense, market liquidity is a measure of the ease with which assets can be bought or sold in the financial markets without significantly impacting their prices. It represents the fluidity and efficiency of market transactions, much like the circulatory system in our bodies ensures smooth functioning and distribution of blood to various organs.
High liquidity is desirable for traders, as it provides a more stable and predictable market environment. This is because, with high liquidity, there are typically more buyers and sellers present in the market, resulting in tighter bid-ask spreads and faster order execution.
Liquidity is dynamic, shaped by numerous factors such as economic news, market events, and the actions of retail investors, institutional players, and market makers. For traders, monitoring and understanding liquidity dynamics is essential, as it directly affects the strategy they use and overall trading success.
Liquidity as Resting Orders in the Market
In a narrow sense, liquidity can be thought of as the collection of resting orders in the order book. These orders include limit orders, stop loss orders, and stop limit orders that are placed by traders at specific price levels. As prices interact with these levels, these orders are activated, creating buying or selling pressure in the market.
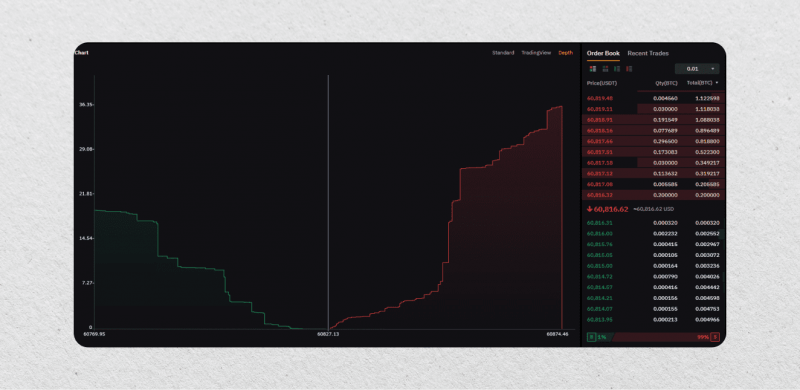
Monitoring these resting orders can provide valuable insights into market sentiment and potential price movements for traders. Typically, a large concentration of limit orders at a particular price level could indicate strong resistance to upward price movement, while a significant number of orders below the current market price may suggest potential support levels.
Thus, almost all technical analysis techniques take into account the factor of liquidity to predict where the price is possibly headed next.
Liquidity is primarily sought after by major market players such as banks, hedge funds, and others. Major players can clearly see where the most stop orders are located in the market, which is the basis for price movement from one liquidity zone to another, thereby collecting money from retail traders.
The Concept of Liquidity Zones
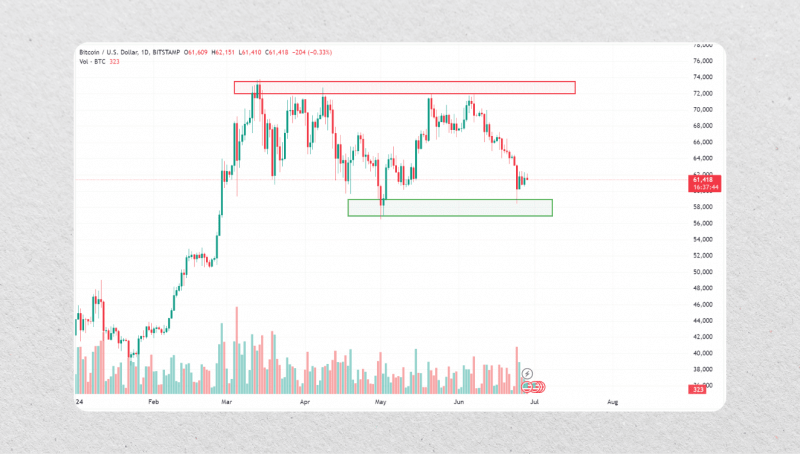
One of the ways traders exploit market liquidity is through the identification and analysis of liquidity zones. Unlike support and resistance levels, liquidity zones are not static price levels but rather dynamic areas where significant concentrations of resting orders exist, making them vital for predicting price movements.
A liquidity zone is created when a large number of market participants place their orders at similar price levels, resulting in a buildup of buy or sell positions. These zones can be identified by observing historical price action and looking for highs and lows within the structure.
Liquidity zones can be divided into two types:
- Supply zones: These are areas where sellers have placed limit orders to sell an asset, creating downward pressure on prices.
- Demand zones: On the other hand, demand zones consist of a concentration of buy orders that create upward pressure on prices.
Let’s have a few words about stop losses.
When traders enter a position, they often set stop-loss orders at specific levels to manage their risk in case the trade goes against them. A stop-loss order is automatically triggered when the price reaches a certain level, converting the active trading position into a market order to close it at the current market price.
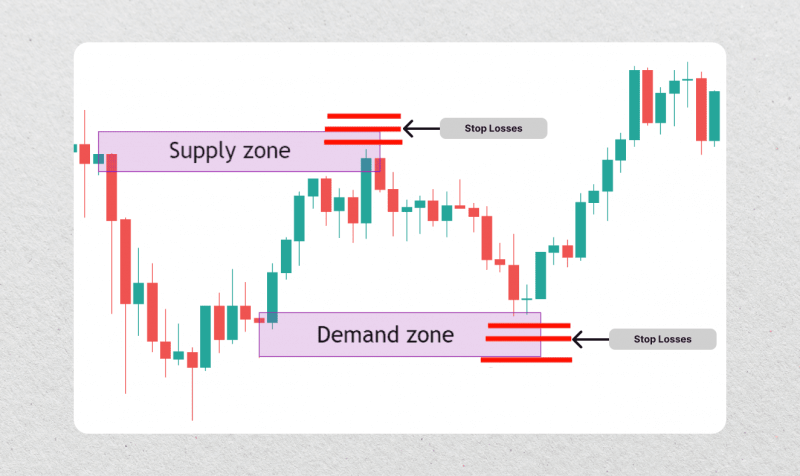
Usually, traders tend to place their stop losses below or above a liquidity zone, as these are areas where prices might potentially reverse. When prices approach these zones, it often triggers a domino effect of stop-loss orders being hit, leading to increased buying or selling pressure and causing significant price moves.
This inertial movement of price is known as a liquidity sweep.
What Are Liquidity Sweeps?
The term ‘liquidity sweep’ refers to the clearing of resting orders like a broom sweeping through an area. According to the smart money theory, these sweeps are deliberately initiated by institutional players to ‘hunt’ for stop loss orders and fill their large orders at better prices.
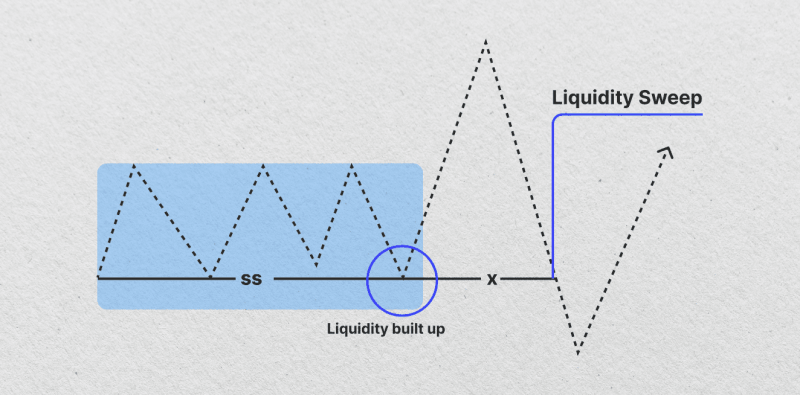
Liquidity sweeps can occur in both supply and demand zones.
- In a supply zone, prices may sweep through the area, triggering stop losses and buying pressure from retail traders before reversing back down. This is commonly referred to as a ‘bear trap.’
- On the other hand, in a demand zone, prices may sweep through the area, triggering stop losses and selling pressure from institutional players before reversing back up. This is known as a ‘bull trap.’
In either case, these sweeps create significant price movements that traders can capitalize on by correctly identifying the liquidity zones. However, it is also essential to note that not all price movements are a result of liquidity sweeps, and careful analysis is required before entering a trade.
How to Identify Liquidity Sweeps in the Market
Identifying a liquidity sweep in Forex and other markets requires a vigilant and analytical approach. Traders should closely monitor how prices approach and breach the identified liquidity zones, paying close attention to the current order flow and overall market conditions.
The first step for successfully trading these sweeps is to accurately pinpoint liquidity zones on the chart.
Spotting Liquidity Zones
Traders should keep a keen eye on the following key areas when searching for potential liquidity zones:
- Swing Highs and Swing Lows: These are significant peaks and troughs in the market, where traders often place orders based on expected support or resistance levels.
- Support and Resistance Levels: Historical price levels that have consistently influenced market movements are closely watched for potential liquidity buildup.
- Fibonacci Levels: These technical analysis tools, which are widely used by traders, can also serve as magnets for order clustering.
- Round Numbers: Prices that end in round numbers, such as 1.0000 or 100.00, should also be closely monitored for potential liquidity accumulation due to their psychological significance among traders.
Use a combination of these techniques for the best result, and be prepared to execute your liquidity sweep strategy.
Spotting Liquidity Sweeps
The key signs to look for when spotting a liquidity sweep include:
- Decisive Price Movements: Observe sharp and sudden price shifts that extend beyond the established liquidity zones, often accompanied by a noticeable increase in trading volume.
- Order Flow Analysis: Monitor the order book and trading activity to detect any significant changes or imbalances that may signal the activation of clustered orders.
- Potential Reversal or Deceleration: Look for signs of a price reversal or a slowdown in momentum once the price has reached and interacted with the liquidity zones, as this may indicate that the sweep has occurred and the market is absorbing the liquidity.
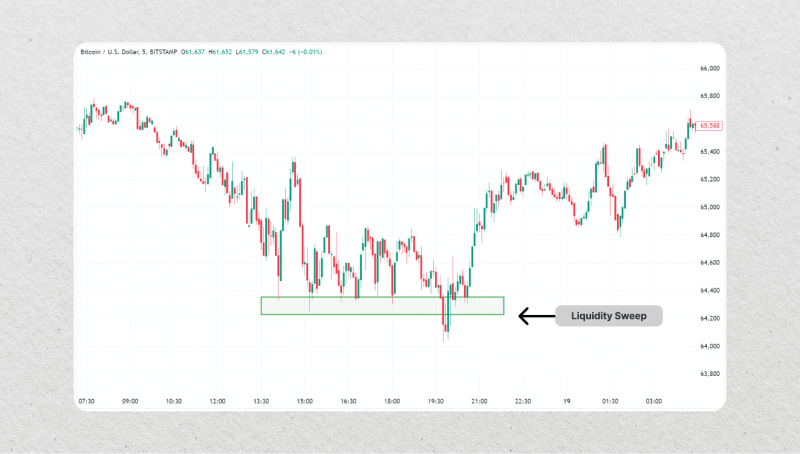
By combining these observations, you can discern whether a major price movement is the result of a liquidity sweep, allowing them to make more informed trading decisions.
Liquidity Sweeps vs. Liquidity Runs
It’s crucial to differentiate between two related concepts: liquidity sweeps and liquidity runs. While both involve targeting liquidity, their outcomes and implications on market trends are different.
Liquidity Sweeps
A liquidity sweep occurs when the price targets a specific level, usually associated with an established support or resistance zone, to capture the existing orders in that area and potentially trigger further trading activity. Once these orders are triggered, there may be a subsequent reversal or deceleration of the price movement.
Liquidity Runs
On the other hand, a liquidity run occurs when the price moves decisively in one direction, targeting multiple liquidity zones along its path and not reversing its course. This type of event is often seen as a continuation of the prevailing short-term trend, with the price gathering liquidity before making a major move in its established direction.
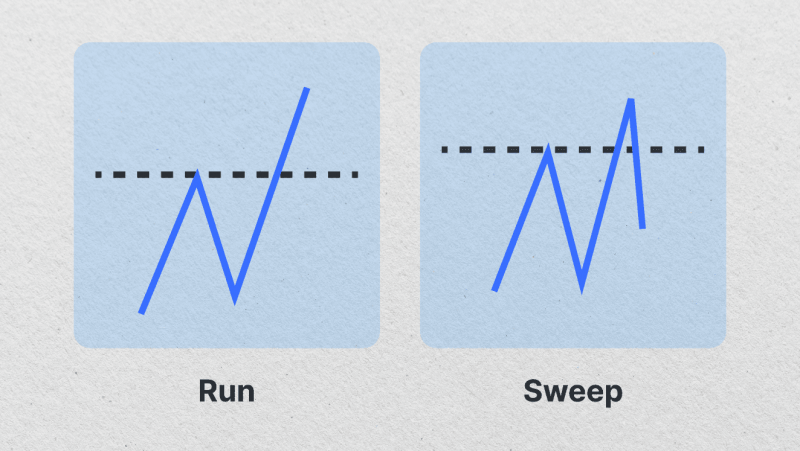
Understanding the nuances between these two concepts is essential for traders to accurately identify and respond to the market’s dynamics.
How to Leverage Liquidity Sweeps in Trading Strategies
Savvy traders have learned to incorporate liquidity sweeps into their overall trading strategies, using them as valuable indicators for improving trading outcomes.
Identifying the Trend Direction
The first step in leveraging liquidity sweeps is to establish the prevailing market trend. By analyzing the series of higher highs and lower lows, you can determine the overall direction of the market, which will inform an approach to identifying and responding to liquidity sweeps.
Locating Liquidity Zones
Within the identified trend, focus on pinpointing the key liquidity zones, which could be significant recent swing points or areas marked by consistent support and resistance levels.
Observing Order Blocks and Fair Value Gaps
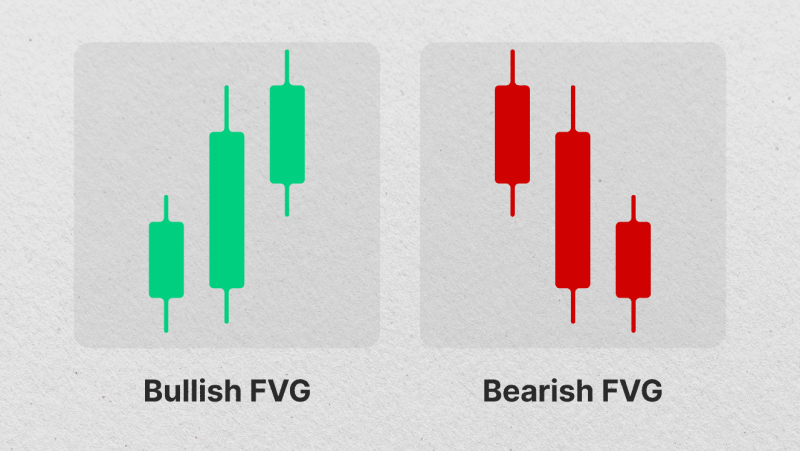
Once the liquidity zones have been identified, look for the presence of order blocks beyond these zones. The existence of a fair value gap (FVG) near the order block further increases the likelihood of the block being targeted, as these gaps are often filled by the market.
The fair value gap is a three-candle pattern, characterized by strong price movement in the second candle, which effectively creates an area of minimal resistance for the price to pass through.
Executing Trades
Once you have identified a liquidity sweep setup, wait for confirmation before entering a trade. A break above or below the order block, accompanied by an increase in trading volume and order flow activity, is often considered a confirmation of the sweep. Place a trade in the direction of the prevailing trend, with appropriate risk management measures in place.
Enhancing Entry Confidence
The occurrence of a liquidity sweep into an order block not only suggests a potential reversal but also boosts the trader’s confidence in the position. This confidence stems from the understanding that the market’s momentum, required to reach the order block, has been supported by the liquidity sweep.
Liquidity Void: The Counterpart to Liquidity Sweeps
A liquidity void is a sudden absence of balance between buyers and sellers, leading to rapid price changes between two levels. These gaps in market liquidity can be characterized by large jumps on charts and are also known as “imbalances.”
These voids can occur after major news releases, during off-market hours, or due to large institutional traders that can move the broader market significantly with a single order. They represent areas where there is no consensus on price, creating increased volatility as the market later attempts to fill these gaps. Just like liquidity zones, these voids have a lasting impact on market dynamics and can greatly influence trading strategies and analysis.
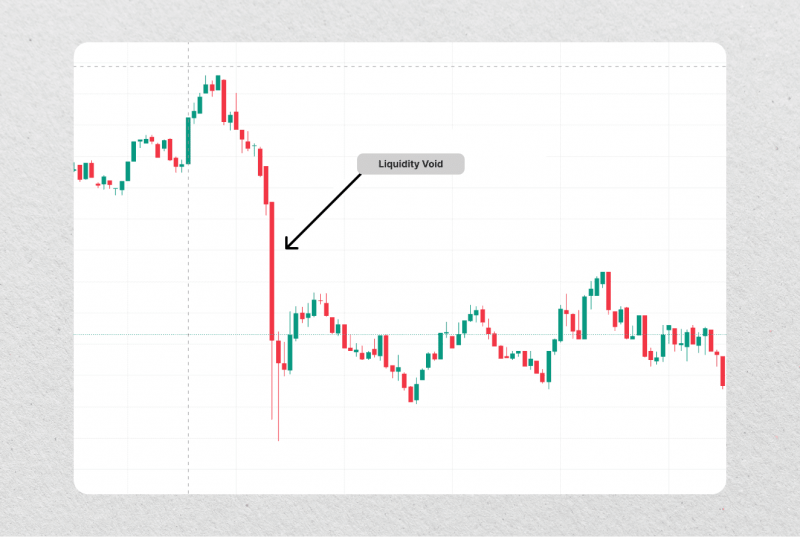
As with any market event, traders must carefully analyze and navigate through liquidity voids. These gaps bring forth increased market volatility and unpredictability, making it crucial for traders to closely monitor the current order flow and overall conditions when approaching these areas.
Traders should pay attention to how prices approach and breach these gaps, keeping an eye out for potential stop-loss hunting or institutional order-filling behavior. Careful analysis and chart reading skills are crucial in distinguishing between a liquidity void and a regular price movement.
Liquidity Void Trading Strategies
Traders can employ the following strategies to capitalize on liquidity voids:
Identify Buy-Side and Sell-Side Voids
Closely monitor the market for areas where the price action indicates a buy-side void (low demand due to high prices) or a sell-side void (low demand due to low prices). These voids can signal potential reversal points.
Wait for Price Corrections
When a buy-side or sell-side void is observed, traders can wait for the price to retract and correct before entering a position. This approach aims to capitalize on the anticipated reversal in the market’s direction.
Utilize Stop-Loss and Take-Profit Orders
Given the potential for extended price movements during liquidity voids, it is crucial to employ stop-loss and take-profit orders to manage risk and lock in profits effectively.
Adapt to Market Conditions
Recognize that market conditions can change rapidly, and what works today may not be as effective in the future. Continuously monitor and adapt your liquidity-void trading strategies to ensure they remain relevant and effective.
Where Do Brokers Find Liquidity for Their Order Books?
But how do brokers and exchanges ensure the liquidity of their platforms?
In Traditional Markets
In traditional markets, such as stocks, energy, commodities, and Forex, brokers usually route orders to entities called liquidity providers. A liquidity provider is usually a big bank, market maker, hedge fund, or Prime of Prime brokerage that acts as a counterparty to your trades. They supply the market with buy and sell orders at specific price levels, ensuring that there is enough liquidity for traders to execute their orders.
Some prominent institutions and brokers, instead of connecting to multiple liquidity providers, act as market makers themselves. They have a large number of orders resting in the order book, which they use to facilitate trades and earn profits from the bid-ask spread.
In Decentralised Markets
In the decentralized finance (DeFi) field of cryptocurrency markets, the liquidity of exchanges is supported by mechanisms called automatic market makers (AMMs) and liquidity pools. AMMs use mathematical algorithms to set prices and provide liquidity from a pool of funds contributed by liquidity providers.
A liquidity pool is a collection of assets, usually two different cryptocurrencies, that users contribute to provide liquidity to a specific trading pair on an AMM-based exchange. In return, these providers receive a share of the trading fees generated by the exchange.
The use of liquidity pools and AMMs has radically changed the crypto ecosystem, enabling traders to access various tokens without relying on traditional intermediaries such as banks or brokers.
Conclusion
Liquidity sweeps are a powerful phenomenon that offers savvy traders the opportunity to capitalize on strategic price movements and enhance their overall trading performance. With the right knowledge and skills, traders can take advantage of market movements and significantly enhance their performance. However, mastering liquidity sweeps is an ongoing process that requires continuous analysis, adaptability, and risk management.
As with any form of trading, it is important to always approach liquidity sweeps with caution and implement proper risk management techniques to prevent losses.
Wondering how these solutions can boost your business?
Leave a request, and let our experienced team guide you towards unparalleled success and growth.
FAQ
What is a liquidity sweep?
A liquidity sweep is when institutional players trigger stop losses and buying/selling pressure before reversing the price movement. This can create opportunities for traders, but careful analysis is necessary before entering a trade.
What happens after a liquidity sweep?
After a liquidity sweep, there may be a subsequent reversal of the price movement.
What is the difference between a liquidity run and a liquidity sweep?
A liquidity sweep targets a specific level to trigger stop orders and cause a reversal. A run moves in one direction without reversing, gathering liquidity before making a major move. It is seen as a continuation of the short-term trend.


