What is RSI & How to Use RSI in Trading?
Feb 07, 2024
The Relative Strength Index, frequently abbreviated as RSI, is a technical analysis tool trend traders use to assess market momentum. While it’s not a surefire ticket to accurate predictions in the market, RSI is a time-tested charting instrument that remains among traders’ favourite trading indicators today.
In this article, we’ll take a closer look at what RSI is and how it is applied in analysing market trends.
Key Takeaways:
- RSI is used to analyse the intensity of the price trends of assets.
- Key levels on the RSI scale are 70 and 30, which indicate possible levels of price extremes.
- Traders use this indicator in various ways, such as identifying divergences, tracking market trends, and spotting a positive or negative reversal.
What Does RSI Show?
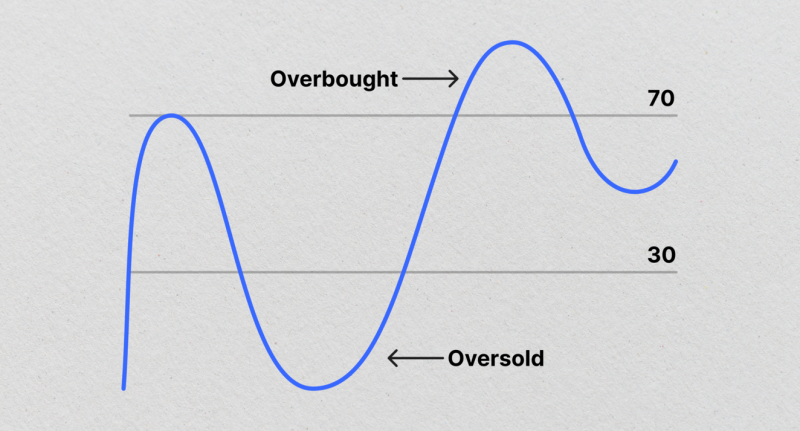
RSI operates as an oscillator fluctuating between 0 and 100. This tool is pivotal for traders as it gives them insights into the resilience of the market. An RSI above 70 implies that the market is overbought, and a reading below 30 signifies an oversold condition.
Where Did This Indicator Come from?
The RSI was created by J. Welles Wilder and first introduced in Commodities magazine (which is known today as Modern Trader) back in June 1978. Wilder then went on to publish a book titled “New Concepts in Trading Systems”, where he explained the essence of RSI in detail.
This publication catapulted the RSI oscillator to the forefront of traders’ attention and has since helped countless users assess market strength.
J. Welles Wilder, who is an engineer by education, has made significant contributions to technical analysis through his research and expertise. He is a renowned stock trader, developer of many trading systems and indicators, and author of several books. Wilder’s dedication to technical analysis has greatly influenced the field and continues to impact traders worldwide.
How to Calculate RSI?
The calculation of RSI involves an analysis of average profits in relation to average losses over a defined duration, commonly established at 14 days but customizable based on individual investment strategies. This calculation is what helps determine how confident the price movement is and how the trend might shift.
To calculate RSI, you first need to determine the average gain and loss during the chosen period. This is done by summing up the percentage gains and losses and dividing them by the number of periods. The resulting numbers are then used in the formula to calculate the RSI value.
The RSI formula looks like this:
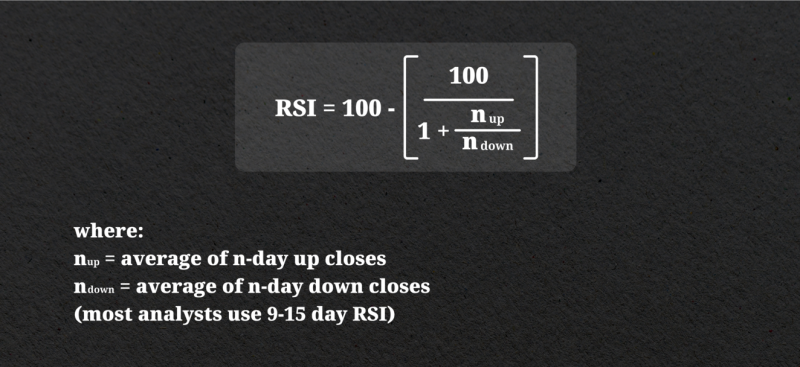
The default setting for the RSI period is 14, but traders can adjust it to their needs or trading style. A shorter period will produce a more sensitive RSI, while a longer one will give a smoother reading.
It’s worth noting that the RSI formula does not take into account factors such as market news or external events. Therefore, it should be combined with other tools and considering the context of the news for a more comprehensive analysis.
How to Read RSI
There are multiple ways to interpret the RSI, depending on the market situation and tactics employed by traders. So, how do you use the RSI indicator?
Possible Level of Price Extremes
Previously, we highlighted the principal purpose of RSI in evaluating whether a given financial instrument is overbought or oversold.
The RSI measurement surpassing 70 serves as an alarm that the asset is overbought, signalling a potential shift in its direction. In contrast, if the RSI measurement falls under 30, it signifies an oversold asset that could be on the verge of a price rebound or inversion.
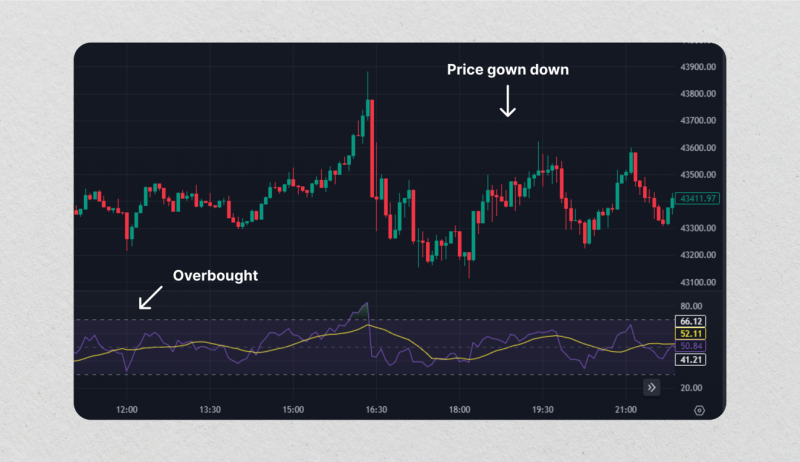
For example, a trader is monitoring ABC stock and notices that the RSI has reached 75 at the price of $50 per share. Based on this information and after analysing other indicators, news and technical analysis data, the trader may decide to sell their ABC stock, anticipating a potential price decline. After that, the stock price of ABC dropped to $45 per share, proving that the trader’s decision was right.
Fast Fact
In contrast to other indicators, such as MACD or Stochastic, RSI does not indicate the direction of price movement but only the degree of price variability.
Divergences
Another RSI trading strategy entails looking for oscillator-price divergences in an asset. When there is an RSI divergence, it means that the momentum indicated by the RSI chart does not match with what is seen in the price chart. A situation like this can signal a potential trend reversal or change in market sentiment.
- Bullish divergence takes place when an investment’s value registers lower lows while the RSI simultaneously forms higher lows. This shows a tapering off of negative momentum, which implies that a bullish shift might be imminent.
- Bearish divergence happens when an investment’s value achieves new heights whilst the RSI concurrently forms lower peaks. This signifies an easing of the upward momentum and anticipates a forthcoming correction.
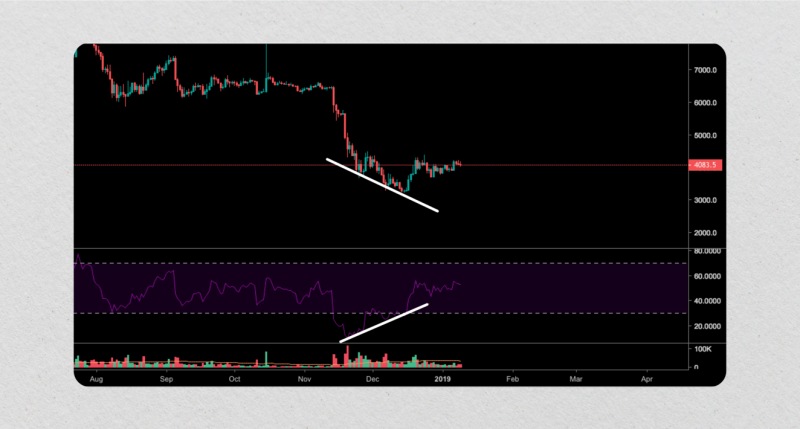
For instance, if a trader is monitoring XYZ cryptocurrency and notices that the price has made higher highs while the RSI has made lower highs, it could be a signal to sell the stock as the momentum may be shifting downwards.
Trend Confirmations
Traders also use the RSI to confirm market trends. When security is trending upwards, the RSI will generally remain above 50, while during a downtrend, it will stay below 50. If the RSI crosses above or below the 50 level, it can be seen as an indication of a potential trend change.
For example, if a trader is analysing LMN stock and sees that the RSI has crossed above 50 and stayed there for a while, it could be a sign of an upward trend. Using this information, the trader may decide to buy LMN stock in anticipation of further price increases.
Positive-Negative Reversals
The RSI can also provide buy or sell signals based on reversal signals. A positive one occurs when the RSI rises above a specific level, such as 50, from below, indicating a possible bearish-to-bullish shift. On the other hand, a negative reversal takes place when the RSI crosses below a specific level, such as 50, from above, suggesting a potential bullish-to-bearish shift.
Fast Fact
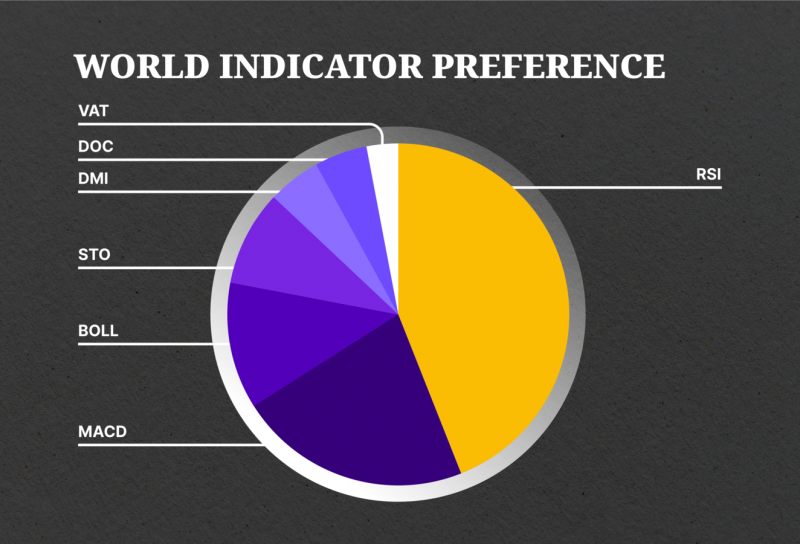
Aside from the Simple Moving Average (SMA), RSI is extremely popular in trading, with a usage rate of 44%. It is closely followed by Moving Average Convergence/Divergence (MACD), Bollinger Bands, and Stochastics.
Tips for Using RSI
Here are a few tips to keep in mind when using RSI:
- Adjusting Ranges: While the standard levels are set at 70 and 30, respectively, they can be modified to fit the current price direction. For instance, during a strong uptrend, RSI may remain above 70 for a long time without necessarily indicating an overbought condition.
- RSI Trendline Utilisation: Traders often create additional trendlines between the 30 and 70 zones for a better analysis of overall trends and extreme RSI readings. By doing so, they can avoid false signals and gain a more accurate picture of the security’s price action.
- Balancing with Other Tools: It’s not prudent to depend solely on one indicator, including RSI. It’s recommended to incorporate other tools or fundamental analysis along with RSI to acquire a well-rounded understanding of the market.
How to Set Up RSI on a Chart
Setting up RSI on a chart is a simple and straightforward process. Here are the steps to follow:
- Choose your preferred trading interface: Some popular platforms include MetaTrader 4 (MT4), TradingView, and Thinkorswim. These platforms allow you to customise your charts and add different indicators, including RSI.
- Select an asset and open a chart: Once you have chosen a trading platform, select an asset or instrument you want to analyse with RSI. This could be a stock, cryptocurrency, commodity, or any other financial asset that is available on your platform.
- Locate the indicators section: Next, locate the section on your trading platform that allows you to add indicators to your chart. In MetaTrader 4, this can be found in the “Insert” tab, while on TradingView, it is located on the left-hand side of the chart.
- Add RSI to your chart: Once you have found the indicators section, search for RSI and add it to your chart. You can also customise its parameters, such as the period or levels, according to your preferences.
- Analyse the RSI readings: Finally, analyse the RSI readings on your chart.
RSI-MACD
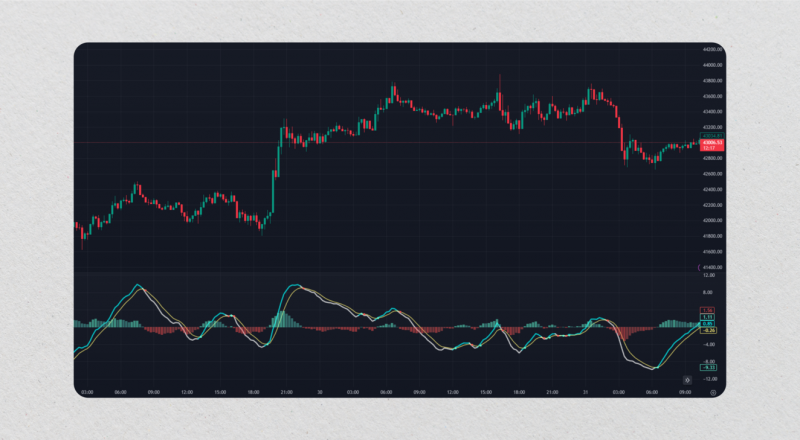
The MACD and RSI are frequently utilised analytical tools that help in assessing price trends and identifying optimal entry points for trades. The two indicators, though distinct in their functions, can enhance each other’s efficiency when used together.
The RSI concentrates on the magnitude of recent price shifts, offering a perspective on the velocity of such changes. Conversely, the moving average is a trend tracker, assisting traders in detecting upcoming reversals. Integrating the MACD and RSI allows for a more comprehensive understanding of a security’s price behaviour.
Drawback of RSI
Despite its usefulness, RSI also has its drawbacks:
- False Signals: During instances of horizontal market movement, the RSI may produce. This can cause traders to open orders based on inaccurate data, ultimately leading to undesired losses.
- Focus on Past Performance: The RSI is a lagging indicator that relies on past price data to calculate its values. As a result, it may not always accurately predict some price movements.
- Solely Focuses on Graphical Data: The RSI does not take into account fundamental factors that can influence a security’s price. Economic news, earnings reports, and overall sentiment greatly affect an instrument’s performance, which the RSI alone may not capture.
Closing Thoughts
It’s critical to understand that every indicator must be applied with care and should not be the only source of reliance due to the fast-paced fluctuations within markets. Although RSI can serve as a valuable tool in detecting trading signals, it’s important to combine it with other techniques to create a more precise RSI trading strategy.
Disclaimer: This article is for informational purposes only and does not provide investment advice. Trading and investing always carry a high level of risk.
FAQs
What is a good RSI to buy?
A good RSI to buy will typically be under 30, which indicates oversold levels in the market.
Is 50 RSI good?
The RSI 50 level is not necessarily considered “good” or “bad”. It is a neutral level that can serve as a reference point for traders when confirming price trends.
What are the perfect RSI settings?
The perfect RSI settings vary depending on the trader’s utilised strategy. While the default setting for RSI is 14, intraday traders often prefer a smaller range of 8-11 periods to increase sensitivity and better keep track of the market for quick trades.
Can I trade only with RSI?
While it is possible to trade using only RSI signals, it is not advisable as the sole method of analysis. RSI was designed to be used more as a filter and not the main instrument for trading decisions.


