Hanging Man Pattern: How to Identify and Trade It Effectively
May 9, 2025

Markets have a unique way of communicating — and the shapes of candlesticks are among their most telling indicators. The hanging man pattern, while appearing as a subtle hint, frequently indicates something significant: a possible shift in direction. It’s a small candlestick on the chart that conveys a powerful message — a caution that the bullish momentum may be diminishing.
In this guide, we’ll break down exactly what the hanging man tells you — and how to turn that insight into smart trading moves.
Key Takeaways:
- The hanging man stands for a bearish turnaround indicator that signals a potential change in momentum when it appears at the peak of an upward pressure.
- It is identified by a small body with a long lateral shadow and requires validation from the next candlestick.
- The pattern appears more precise when near resistance levels, with high volume, or alongside bearish indicators.
What Does the Hanging Man Figure Stand For?
The hanging man is a type of bearish single-candle flip structure that can signal a hypothetical disturbance in market behavior. It usually forms at the peak of an upward pressure. It resembles the hammer candlestick, but its placement in the trend makes all the difference: while a hammer occurs after a downtrend (bullish transition), the hanging man forms after a rally and warns of a possible bearish breakdown.
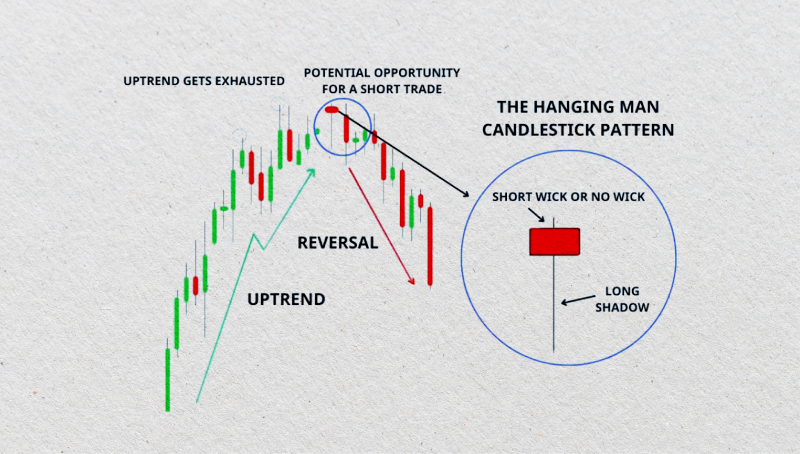
Visually, the hanging man has a small real body (either bullish or bearish) regained near the top of the candle, with a long lower shadow at least twice the thickness of the body. It shows that sellers pushed prices substantially decreased over the course of the trading session, but buyers managed to recover some of the losses by the close. Despite the recovery, the long lower wick exposes underlying weakness in the bullish momentum.
While the hanging man pattern alone can raise a red flag, a strong bearish candle on the next session — ideally with increased volume — is typically needed to validate the rejection signal. Without reinforcement, the sequence may fail, especially in strong bull markets.
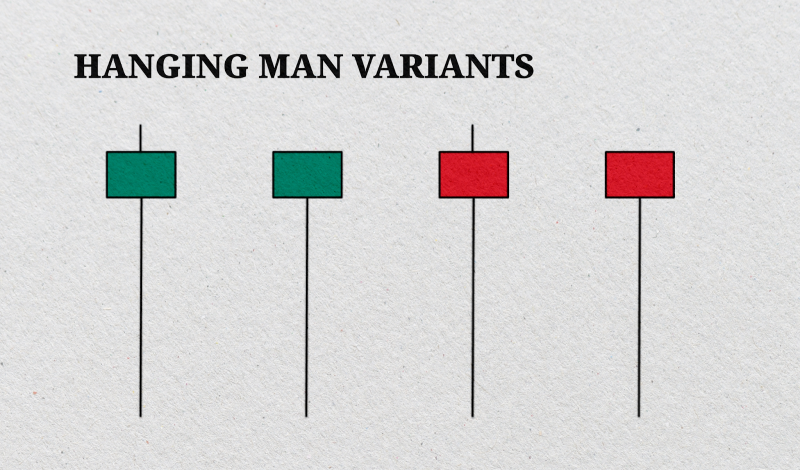
This candlestick shape is widely used across stocks, Forex, crypto, and commodities. It is best analysed with support/resistance levels, trendlines, and technical variables such as RSI or MACD for increased reliability. In essence, it helps traders spot the end of an upward pressure and prepare for a potential price decline or sideways movement.
Fast Fact
Despite its ominous name, the hanging man is not always a signal to panic — without endorsement, it could be just a momentary dip in buyer enthusiasm.
Psychological Interpretation of the Hanging Man Candlestick
The hanging man concept reflects a subtle but critical shift in market psychology that often precedes a bearish turnaround. It captures a moment of hesitation and potential exhaustion in an ongoing upward pressure, where bullish momentum begins to lose strength — even if the surface still shows bullish control.
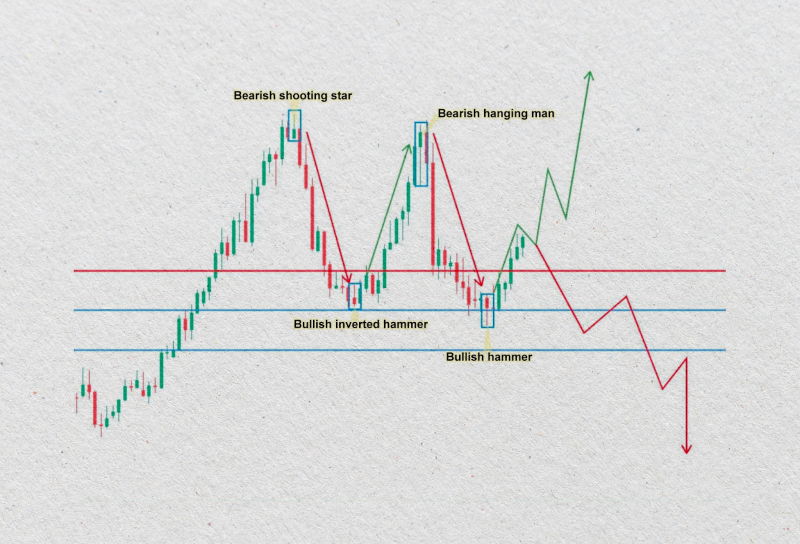
During the evolution of the hanging candle, buyers initially maintained dominance, pushing prices slightly higher or near the previous close. However, at some point during the session, sellers enter aggressively, driving prices sharply downward. This move creates the characteristic long lower shadow, showing that the market was willing to test significantly lower levels.
Despite this bearish pressure, buyers made up some losses by the final hour, resulting in a tiny real body that marked the end of the candle. On the surface, bulls are still in control. But the philosophy behind the move tells a different story: sellers have entered the market with enough strength to challenge the prevailing upward pressure, and buyers are no longer as dominant as they once were.
This tug-of-war indicates growing uncertainty and potential weakness in the bullish trend. Long-time traders may start to question the rally’s sustainability, while short-sellers may begin to position for a pullback.
If the next candle confirms the shift (typically with a strong bearish close), the psychological balance tips decisively in favor of the bears, often leading to a trend turning point or consolidation.
Types of Hanging Man Candlestick Formation
Although the hanging man is technically a single candlestick model, it can appear in a few different forms depending on its color, size, and position on the chart. These subtle variations can give traders extra clues about how strong the supposed decline might be — and how likely it is that the trend is really about to turn.
The following are the common kinds of hanging man pattern candlestick charts that can be found in practice:
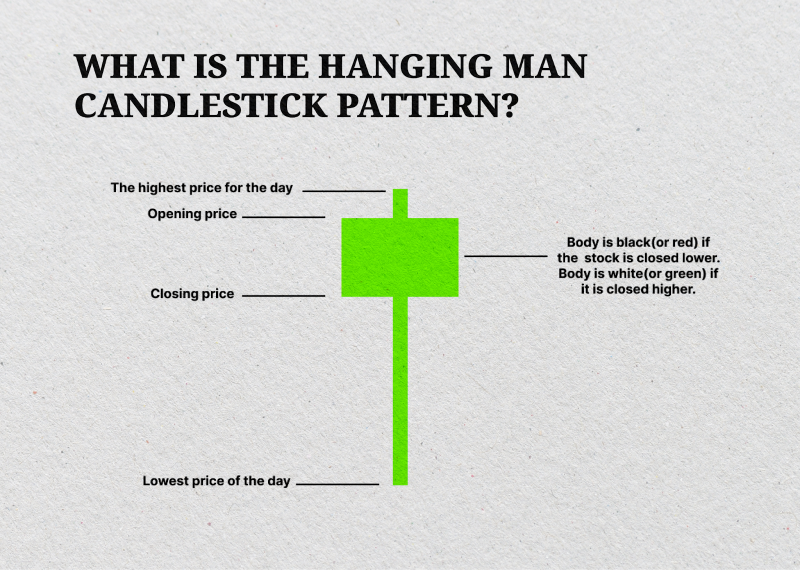
Bullish Hanging Man (White or Green Body)
This version has a small bullish body, which means the candle closed higher than it opened. At first glance, it might not seem like a warning sign — after all, the bulls still managed to push the price up.
But the long downward shadow reveals something important: sellers were active during the session and briefly drove the price down, even if buyers recovered by the close. This version isn’t as threatening as others, but it’s still a caution flag, especially if the next candle turns red.
Bearish Hanging Man (Black or Red Body)
Here, the real body is bearish, meaning the candle closed below its opening price. This subtle difference adds weight to the signal. It shows that sellers drove the price lower during the session and kept it down by the close.
That makes this variation more convincing for traders looking for early signs of a trend turnaround. It’s still smart to wait for validation, but this one usually gets more attention.
Long-Legged Hanging Man
This type has an unusually long lower shadow, sometimes three or four times the size of the body. It shows a sharp intraday sell-off, with buyers only recovering a small portion of the loss.
When this kind of candle shows up at the top of an upward pressure, especially near a key resistance level, it often signals that the market is starting to crack under pressure. Many traders take this as a sign of fear or profit-taking kicking in.
High-Volume Hanging Man
When the hanging man appears in high trading turnover, it’s generally seen as a stronger and more credible signal. The price action isn’t just a fluke — there’s real participation from bigger players.
This can indicate that institutional traders or smart money might be pulling out, which raises red flags for everyone else. Many experienced traders use this as a cue to tighten their stop-losses or reduce long positions.
Shadowless Hanging Man
This is a cleaner, more dramatic version of the figure. The candle opens at or near the high, drops significantly, and doesn’t recover, meaning there’s no upper wick. This signals clear control by sellers and very little buying pressure throughout the session.
It’s not very common, but when it shows up — followed by a gap down or a break below support — it often marks the end of an upward pressure with sharp reversals soon after.
How to Pinpoint a Hanging Man Candlestick Structure?
Discovering a hanging man candlestick pattern involves more than recognising a candle with a long, slimmer shadow. It requires an understanding of the price context, the structure of the candle, and what it indicates about market behavior.
These steps can give a clear idea of finding such a structure on the trading chart:
It Must Occur After an Upward Pressure
For a candlestick chart to qualify as a hanging man, it must appear after a clear upward trend. This could be part of a short-term rally or a longer-term bullish phase, but the key is that the market has been making higher highs and lows. Without this context, the same candle shape could be mistaken for a hammer — a chart with a bullish implication rather than bearish.
Distinctive Candle Shape
The hanging man has a unique structure that makes it stand out. It features a small real body near the top of the candle’s range, with a long lower shadow that’s typically two to three times the length of the body.
There’s usually little to no upper shadow, showing that buyers couldn’t push the price much above the open. This shows sellers could drag the price significantly lower during the session, even if buyers managed a modest recovery by the close.
Candle Color (Helpful, but Not Mandatory)
The real body of a hanging man can be either bullish (green) or bearish (red). While both versions are valid, a bearish-colored candle tends to carry more weight. That’s because a red close means sellers ended the session in control, adding strength to the reversal signal.
Confirmation Is Essential
A single hanging man candle isn’t enough to act on — it must be confirmed by the following session’s price action. Ideally, the next candle should open lower and close below the low of the hanging man. This kind of bearish follow-through suggests that selling pressure is increasing, and a reversal may be underway.
Supporting Factors Add Weight
The reliability of the hanging man increases when it appears near a known resistance level, especially after a sharp rally. High trading activity on the pattern day can signal that large players exit positions. The odds of a successful reversal are even higher if the pattern also lines up with bearish divergence on technical indicators like RSI or MACD.
Tips for Using the Hanging Man Advantageously
The hanging man is a powerful tool in a trader’s candlestick arsenal — but like all price action patterns, its success depends on how and when it’s used. Below are several expert tips to help you maximise the effectiveness of this bearish rejection signal:
- Always Wait for Information
One of the most common mistakes is acting on the hanging man without holding out for verification. The structure on its own only signals potential, not certainty. A strong, bearish candle that follows (ideally closing below the hanging man’s low) adds conviction and filters out false signals, especially in trending markets.
- Use It Within the Right Market Context
This structure works best when it forms after a clear upward pressure. A hanging man has little to no relevance without an existing bullish move. Avoid interpreting the pattern sideways or in choppy conditions, where price action can be noisy and misleading.
- Combine with Key Resistance Levels
The hanging man becomes more meaningful near major resistance zones, psychological round numbers, or trendlines. These areas often attract selling pressure on their own — when combined with the Hanging Man, they significantly boost the odds of a reversal.
- Monitor Volume for Added Clarity
While volume isn’t a requirement, increasing trading value during the development of a hanging man can signal institutional activity or heavy profit-taking. This adds further weight to the anticipated rebound and may signal that “smart money” is stepping out.
- Use It Alongside Technical Indicators
Validate the signal using tools such as the Relative Strength Index or MACD. A bearish divergence occurs when the price hits a new high while the indicator does not, which can strengthen the notion that bullish momentum is waning and a reversal may be imminent.
- Manage Risk with Smart Stop Placement
Because no pattern is foolproof, risk management is essential. A common approach is to place a stop-loss just above the high of the hanging man candle. This helps limit potential losses if the sequence fails and the upward pressure resumes.
- Don’t Use It in Isolation
Ultimately, don’t depend exclusively on candlestick formations like the hanging man when making trading choices. Incorporate it into a comprehensive trading strategy that involves trend evaluation, support and resistance levels, and robust risk management principles.
Conclusion
The hanging man structure may be small, but it can speak volumes about market mentality. When properly identified and confirmed, it offers traders a powerful clue that an expansion could be nearing its end. But like any candlestick arrangement, context is everything.
Enhance the effectiveness of the hanging man structure by pairing it with volume spikes, key resistance areas, and supporting indicators. No matter your experience level, developing the skill to spot this signal can give you a crucial advantage — helping you react to foreseeable turnarounds faster and safeguard your trades more effectively.
FAQ
Is the hanging man model always bearish?
No, it’s a bearish breakout signal only when it appears after an upward pressure. In a downward motion, it might be confused with a bullish Hammer.
What timeframe is best for spotting a hanging man?
It can appear on any timeframe, but is most reliable on daily charts or higher, especially near key resistance zones.
Can I trade the hanging man without a signal?
It is possible to proceed, but there are risks involved. Most experienced traders tend to linger for bearish approval in the next candle before executing a trade.
How is hanging man different from the hammer structure?
Both look alike, but serve opposite roles: the hammer implies a bullish rebound after a slump, while the hanging man warns of weakness after an upward pressure.
