What Is A Bitcoin Stock-To-Flow Model? Beginner’s Guide
Apr 13, 2022

Bitcoin, the world’s leading cryptocurrency, has gained significant attention in the financial world in recent years, but its value can be highly volatile, making it challenging for investors to make informed decisions. The Stock-To-Flow (S2F) model is a popular analytic tool used in the crypto world to predict price trends by analyzing the ratio between the total stock of a commodity and its annual production rate.
In this beginner’s guide, we’ll explore the basics of the S2F model, how it works, and its applications in Bitcoin trading. We’ll also discuss the limitations and criticisms of this model, helping you make informed decisions when investing in Bitcoin.
Key Takeaways
- The stock-to-flow model compares the total supply of a commodity with its new supply each year.
- The stock-to-flow model can be applied to Bitcoin to predict its price trends based on scarcity.
- The model’s limitations include not accounting for external factors such as demand, volatility, and global economic conditions.
- Combining the stock-to-flow model with other analytical tools such as Elliott Wave Theory, Fulcrum Index, Greater Fool Theory, and Rainbow Charts can result in more accurate predictions.
- Past performance is not an indicator of future performance, and investors must do their own research and consider other factors when making investment decisions.
What is Stock To Flow, Generally?
The stock-to-flow model is widely utilized in the commodity pricing industry. As the name suggests, the model evaluates two characteristics, stock, and flow.
Stock refers to the total amount of a commodity or cryptocurrency currently circulating. Flow denotes the annual increase in the available supply of the commodity or cryptocurrency. You can tell how plentiful a commodity is by comparing these two measures.
Consider gold as a case in point. In total, almost 187,000 metric tonnes of gold have been extracted from the earth so far. Gold and precious metals can’t be destroyed easily. Therefore, there’s still plenty in circulation.
Let’s have a look at the economic model for the annual gold production now. The annual gold production is approximately 3,000 metric tons, as the World Gold Council reported. This represents the model’s flow side.
Gold’s current stock-to-flow ratio can be calculated as follows: stock/flow. The formula goes something like this:
187,000 / 3,000 = 62.3
Using that ratio to collect all of the gold ever mined will take you about 62 years. If the stock-to-flow ratio is high, the resource is in short supply.
How Is The S2F Model Used for Bitcoin?
One of Bitcoin’s most distinctive qualities is that its annual supply increase is fixed. As a result, Bitcoin’s stock-to-flow can be modeled with a high degree of accuracy, unlike other commodities that rely on mining and other supply growth estimations with a lower degree of precision.
A maximum supply of 21 million Bitcoins are available, and almost 19.2 million have already been mined. Bitcoins are “mined” when transaction requests on the blockchain are verified on a predefined schedule. The last Bitcoin is anticipated to be released into circulation in the year 2140.
The current block reward for miners is 6.25 Bitcoin. That’s equivalent to 328,500 BTC yearly if a block is mined every 10 minutes. Hence, here is how the stock-to-flow ratio for Bitcoin stands right now:
19,171,050 / 328,500 = 58.35
How Does Bitcoin’s Scarcity Affect The Stock-to-Flow Ratio?
The halving event is a significant factor in Bitcoin’s scarcity. The rate at which miners create new Bitcoin is halved every four years. Initially, miners were awarded 50 bitcoins per block for their efforts. The sum was cut in half to 25 bitcoin in 2012 and again to 12.5 bitcoin in 2016. The current block reward as of April 2023 is 6.25 Bitcoin.
The ratio of Bitcoin’s stock to its flow is expected to rise as the trend of fewer new coins entering circulation persists.
As time passes, fewer bitcoins will be added to the circulation, leaving the market price to be set exclusively by demand. Because of this, some have made optimistic forecasts about Bitcoin’s price in the future.

Problems And Limitations Of S2F for BTC
Although there has been a correlation between the stock-to-flow ratio and Bitcoin’s price in the past, this approach has several drawbacks we need to address before making our price predictions dependent on it.
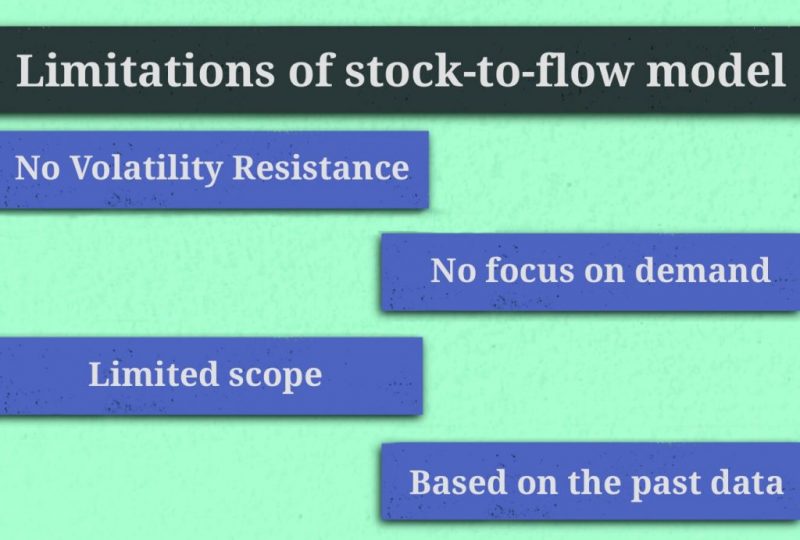
No Volatility Resistance
Though Bitcoin’s volatility has decreased somewhat over time, it is still susceptible to big price movements. During extreme volatility, investors may sell their holdings in a panic, forcing traders to close their long positions and precipitating a steep drop in the BTC price.
No Focus On Demand
Additionally, the model focuses on Bitcoin’s supply but disregards the demand for Bitcoin. Supply and demand are the two primary determinants of an asset’s price. Hence, even though every four years during halving events, the S2F ratio of BTC improves, its price will plummet drastically if demand dramatically decreases.
Limited Scope
S2F also has quite a limited scope. It does not consider other factors that can impact the price of Bitcoin, such as market sentiment, regulatory changes, global economic conditions, and competition from other cryptocurrencies.
For instance, in economics, “black swan” events are those that no one saw coming but had far-reaching effects, most notably on the value of an asset. A big regulatory crackdown that bans everyone from purchasing and trading Bitcoin would be a black swan event for Bitcoin. In this hypothetical scenario, the price of BTC could fall dramatically.
Based On The Past Data
Additionally, the S2F model is mainly based on historical data. While something has been accurate in the past, it cannot account for unpredictable events that could impact the future price move of Bitcoin. Therefore, investors should use the Stock-to-Flow model and other analytical tools to make informed investment decisions.
All these could mean that the S2F model may not accurately predict the value of Bitcoin in situations where these external factors play a significant role.
Other BTC Forecasting Methods
Besides the Stock-To-Flow model, numerous other models have emerged to somehow analyze Bitcoin’s price movement and make predictions for the future. Many Bitcoin investors and supporters point to gold’s market cap, which is considered a counter-cyclical inflation hedge, as a reasonable benchmark for Bitcoin’s value.
If Bitcoin ever reached the same market cap as gold, which is currently $11.3 trillion, then each BTC would be worth $540,000. Here are several examples of BTC price forecasting models that might turn out to be extremely useful for the beginners.
- Elliott Wave Theory
Technical analysis of the Elliott Wave Theory is the most popular approach to Bitcoin modeling. This method assumes that the market undergoes predictable bull and bear market cycles based on crowd psychology.
- Fulcrum Index
Another model is the Fulcrum Index, developed by Greg Foss, a credit markets expert. The Fulcrum Index model views Bitcoin as insurance against worldwide sovereign debt. Foss employees credit default swaps to estimate Bitcoin’s intrinsic value, placing it between $108,000 and $160,000. It is a long-term assessment of Bitcoin’s intrinsic value rather than a forward-looking price predictor.
- Greater Fool Theory
Meanwhile, some critics believe that Bitcoin has no inherent value and is overvalued. They use the Greater Fool Theory, a finance principle that says overvalued assets’ price rises only because people buy them with the hope of selling them at a higher price to a greater fool, to argue that Bitcoin is destined to fail.
- Bitcoin Rainbow Chart
The next is the Bitcoin Rainbow Chart, a color-coded logarithmic chart illustrating Bitcoin’s price evolution, developed by Über Holger, CEO of Holger. Holger acknowledges that the colored bands are arbitrary and lack any scientific basis. As such, they are only relevant until some future date, but the model doesn’t specify any timescales.
The chart provides users a visual representation of BTC price changes over time, ignoring daily volatility fluctuations. By analyzing the chart, users can identify past periods when buying or selling BTC was best.
Holger emphasizes that the Rainbow Chart should not be considered investment advice, as past performance does not necessarily indicate future results. Nonetheless, the chart categorizes the various price moves of Bitcoin into eight color-coded bands: definite bubble, FOMO (fear of missing out), sell, bubble formation, still cheap, HODL, buy, accumulate, and deeply discounted.
Whether any of these models will be accurate in the long run remains to be seen. Nevertheless, Bitcoin’s pricing enigma has proven to be a challenging puzzle to solve, and it may require a combination of several models to make informed investment decisions.
How To Trade Crypto Using The S2F Model
Although the stock-to-flow model has some limitations, it can still be a valuable tool for investing in cryptocurrencies. The model suggests that as a cryptocurrency’s stock-to-flow ratio increases, so will its value, based on historical data. This relationship can assist investors in making more informed investment decisions now.
When a cryptocurrency has a high stock-to-flow ratio, such as 50 or more, it indicates relative scarcity and suggests its value will rise. An investor might choose to sell some of their cryptocurrency to profit from its high current price. Alternatively, an investor may decide to buy more when the ratio is low but expected stock to flow line will rise.
FAQs
- What is the Bitcoin S2F model, and has it been historically reliable?
Throughout history, the S2F model has successfully anticipated the Bitcoin price near each halving event. Recently, however, it has been under intense criticism as the difference between its predicted value and the value of Bitcoin has grown.
- What factors affect Bitcoin’s value?
The price of Bitcoin is primarily influenced by its supply, market demand, availability, competing cryptocurrencies, and investor sentiment.
- Is the stock-to-flow model suitable for short-term or long-term investments?
The stock-to-flow model is better suited for long-term investments rather than short-term trading due to its limitations and the unpredictability of external factors.
- How does the S2F model work?
The S2F model divides the total stock of a commodity by its annual production rate to calculate its S2F ratio, which reflects the relative abundance of the commodity.
- Who developed the Bitcoin S2F model?
A pseudonymous Twitter user, PlanB, first introduced the Bitcoin S2F model.
The Bottom Line
The stock-to-flow model is a helpful analytical technique for forecasting Bitcoin and commodity price movements. However, it is essential to remember that this model has limitations, including its inability to account for external factors like demand, market sentiment, legislative changes, global economic conditions, technological improvements, and competition from other cryptocurrencies.
To make educated investing selections, traders should employ the stock-to-flow model alongside other analytical tools and their independent research. The value of cryptocurrencies can be affected by events outside of their control. Therefore, it’s important to remember that past performance does not necessarily indicate future results and be ready for any changes.


